Open-source · MIT · Multi-Node Mesh & V3 Engine
current: jsuzanne/stigix:latest  ·  v3.0.34

An open, customizable & extensible platform
for real SASE / SD-WAN validation

Generate realistic SaaS, East-West Custom TCP, and Enterprise Multicast (IGMPv3/PIM) traffic. Replay stateful PCAPs, inspect live packets in the browser, measure sub-second failover convergence, automate VyOS underlay routers, and orchestrate multi-branch labs from a single container.

Stigix v3: SCM Vertical Rail & 3-Column Command Center SD-WAN Multicast Overlay (IGMPv3 / PIM-SM) & Custom TCP Live Web Wireshark Capture & Stateful L7 PCAP Replay Zero-Touch Magic Join Mesh & 1-Click Fleet Upgrades
Note: This is a personal, community-driven open-source project. It is not an official Palo Alto Networks product and is not supported or endorsed by Palo Alto Networks. All opinions and configurations are the author's own. Use at your own risk.
How It Works

Distributed Multi-Node Architecture

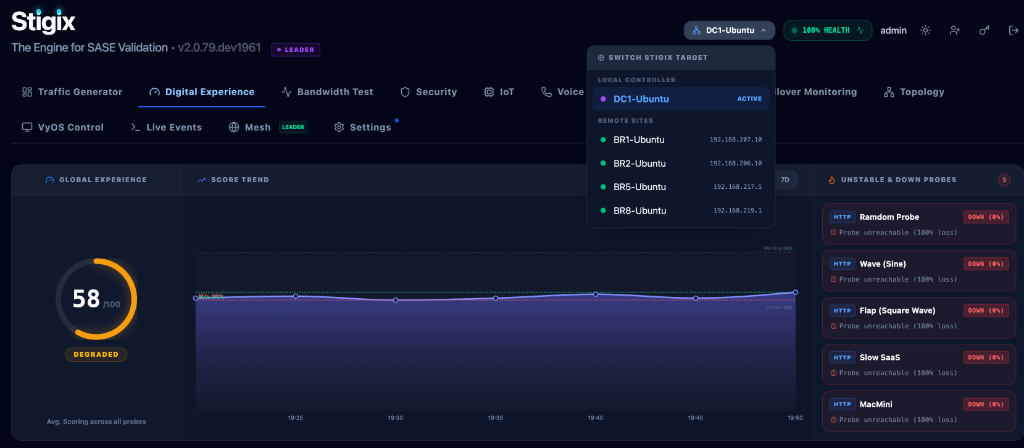
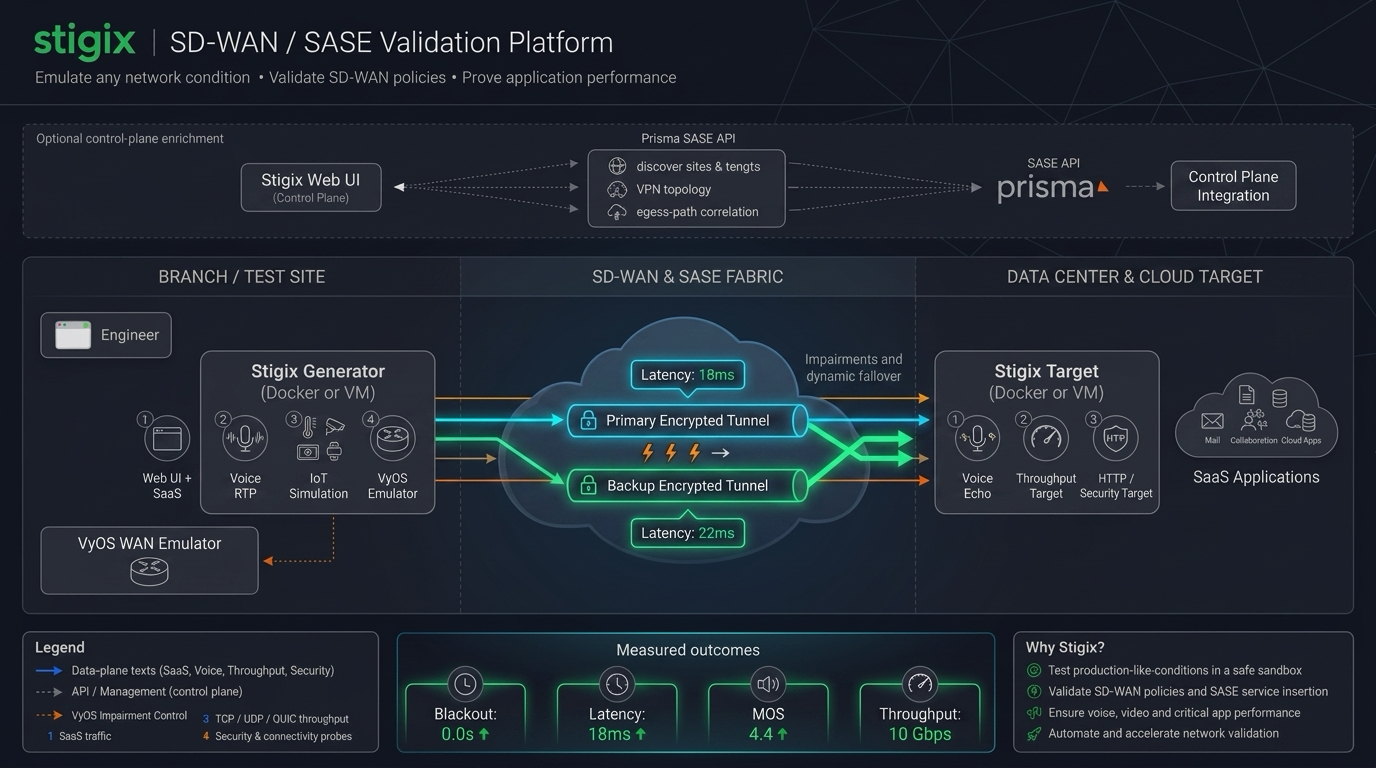
Stigix deploys seamlessly across Datacenters, Branch sites, and Cloud instances. A Leader node orchestrates Central Global Provisioning, while every peer acts concurrently as a traffic sender, custom TCP/Multicast listener, and SLA responder.

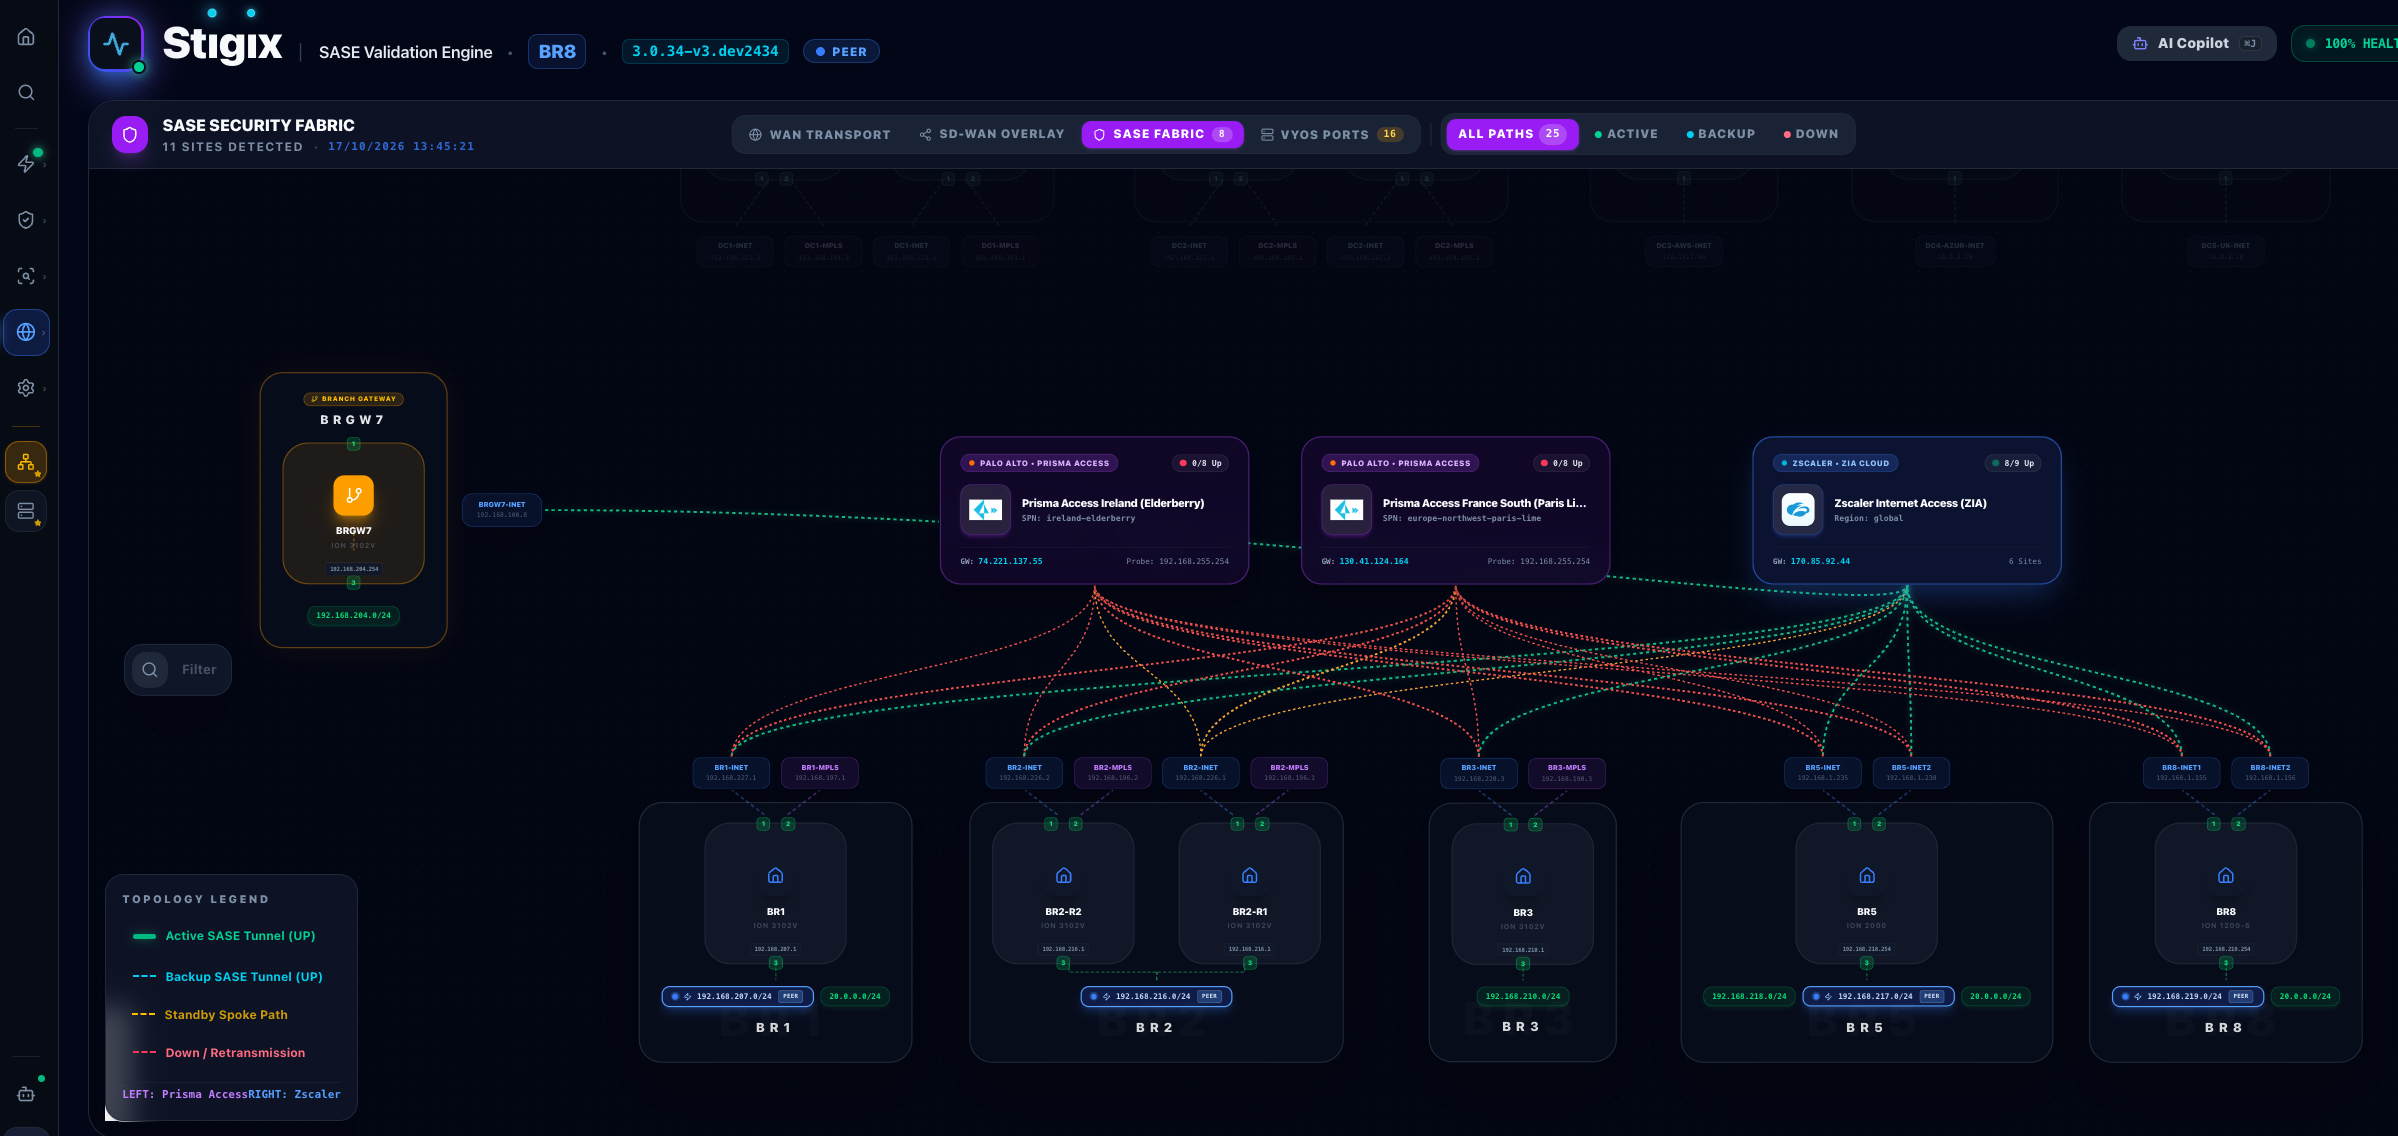
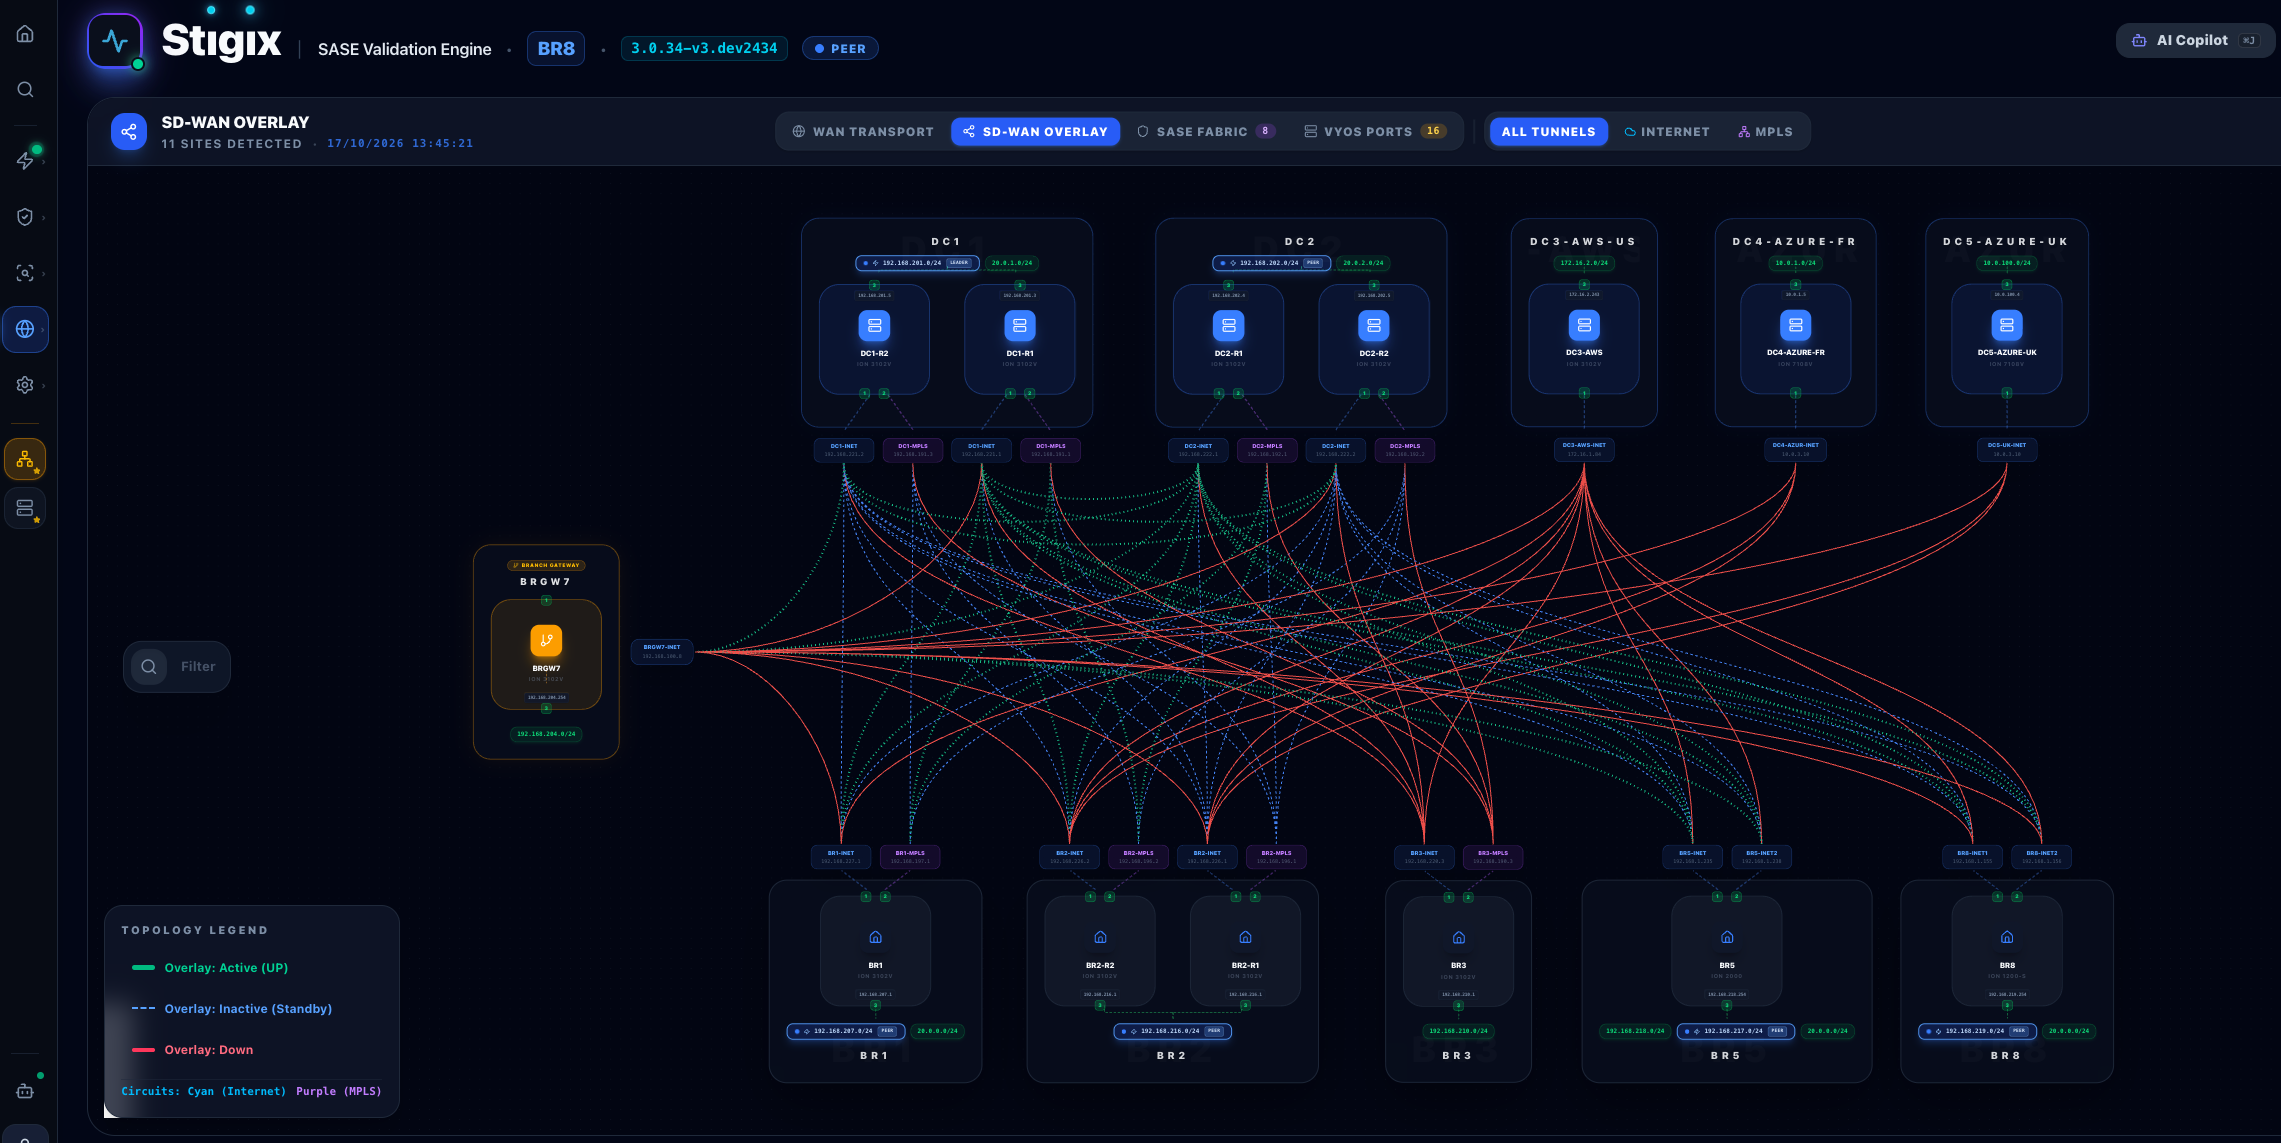
Stigix SD-WAN / SASE Validation Platform Architecture — Branch Site, SD-WAN & SASE Fabric, Datacenter & Cloud Target
Origin
"I built this after years of writing one-off scripts for SD-WAN POCs and never finding a single lab platform that matched what I see in the field."

Every new POC used to mean another set of throwaway scripts to generate SaaS traffic, validate URL/DNS security, or time tunnel convergence. Nothing reusable, and nothing that correlated underlay router impairments with overlay application telemetry.

Stigix brings everything into one container: realistic North-South and East-West traffic generation, multicast overlay validation, live packet inspection, security policy testing, and sub-second failover measurement.

Problems it solves

  • No realistic SaaS, Custom TCP, or Multicast traffic for SD-WAN path steering
  • No single tool combining URL filtering, DNS security, C2, and PCAP replay
  • No zero-touch multi-branch orchestration with centralized configuration sync
  • No sub-second failover convergence curves with automated PoC report cards
  • No native browser packet capture or correlation between VyOS underlay and SD-WAN overlay
  • Voice RTP and Layer-2/3 IoT device simulation requiring custom scripts every time

Platform

Core capabilities

10 integrated validation engines controlled from a unified UI, interactive CLI, and central mesh controller.
Capability
Description
Key specs
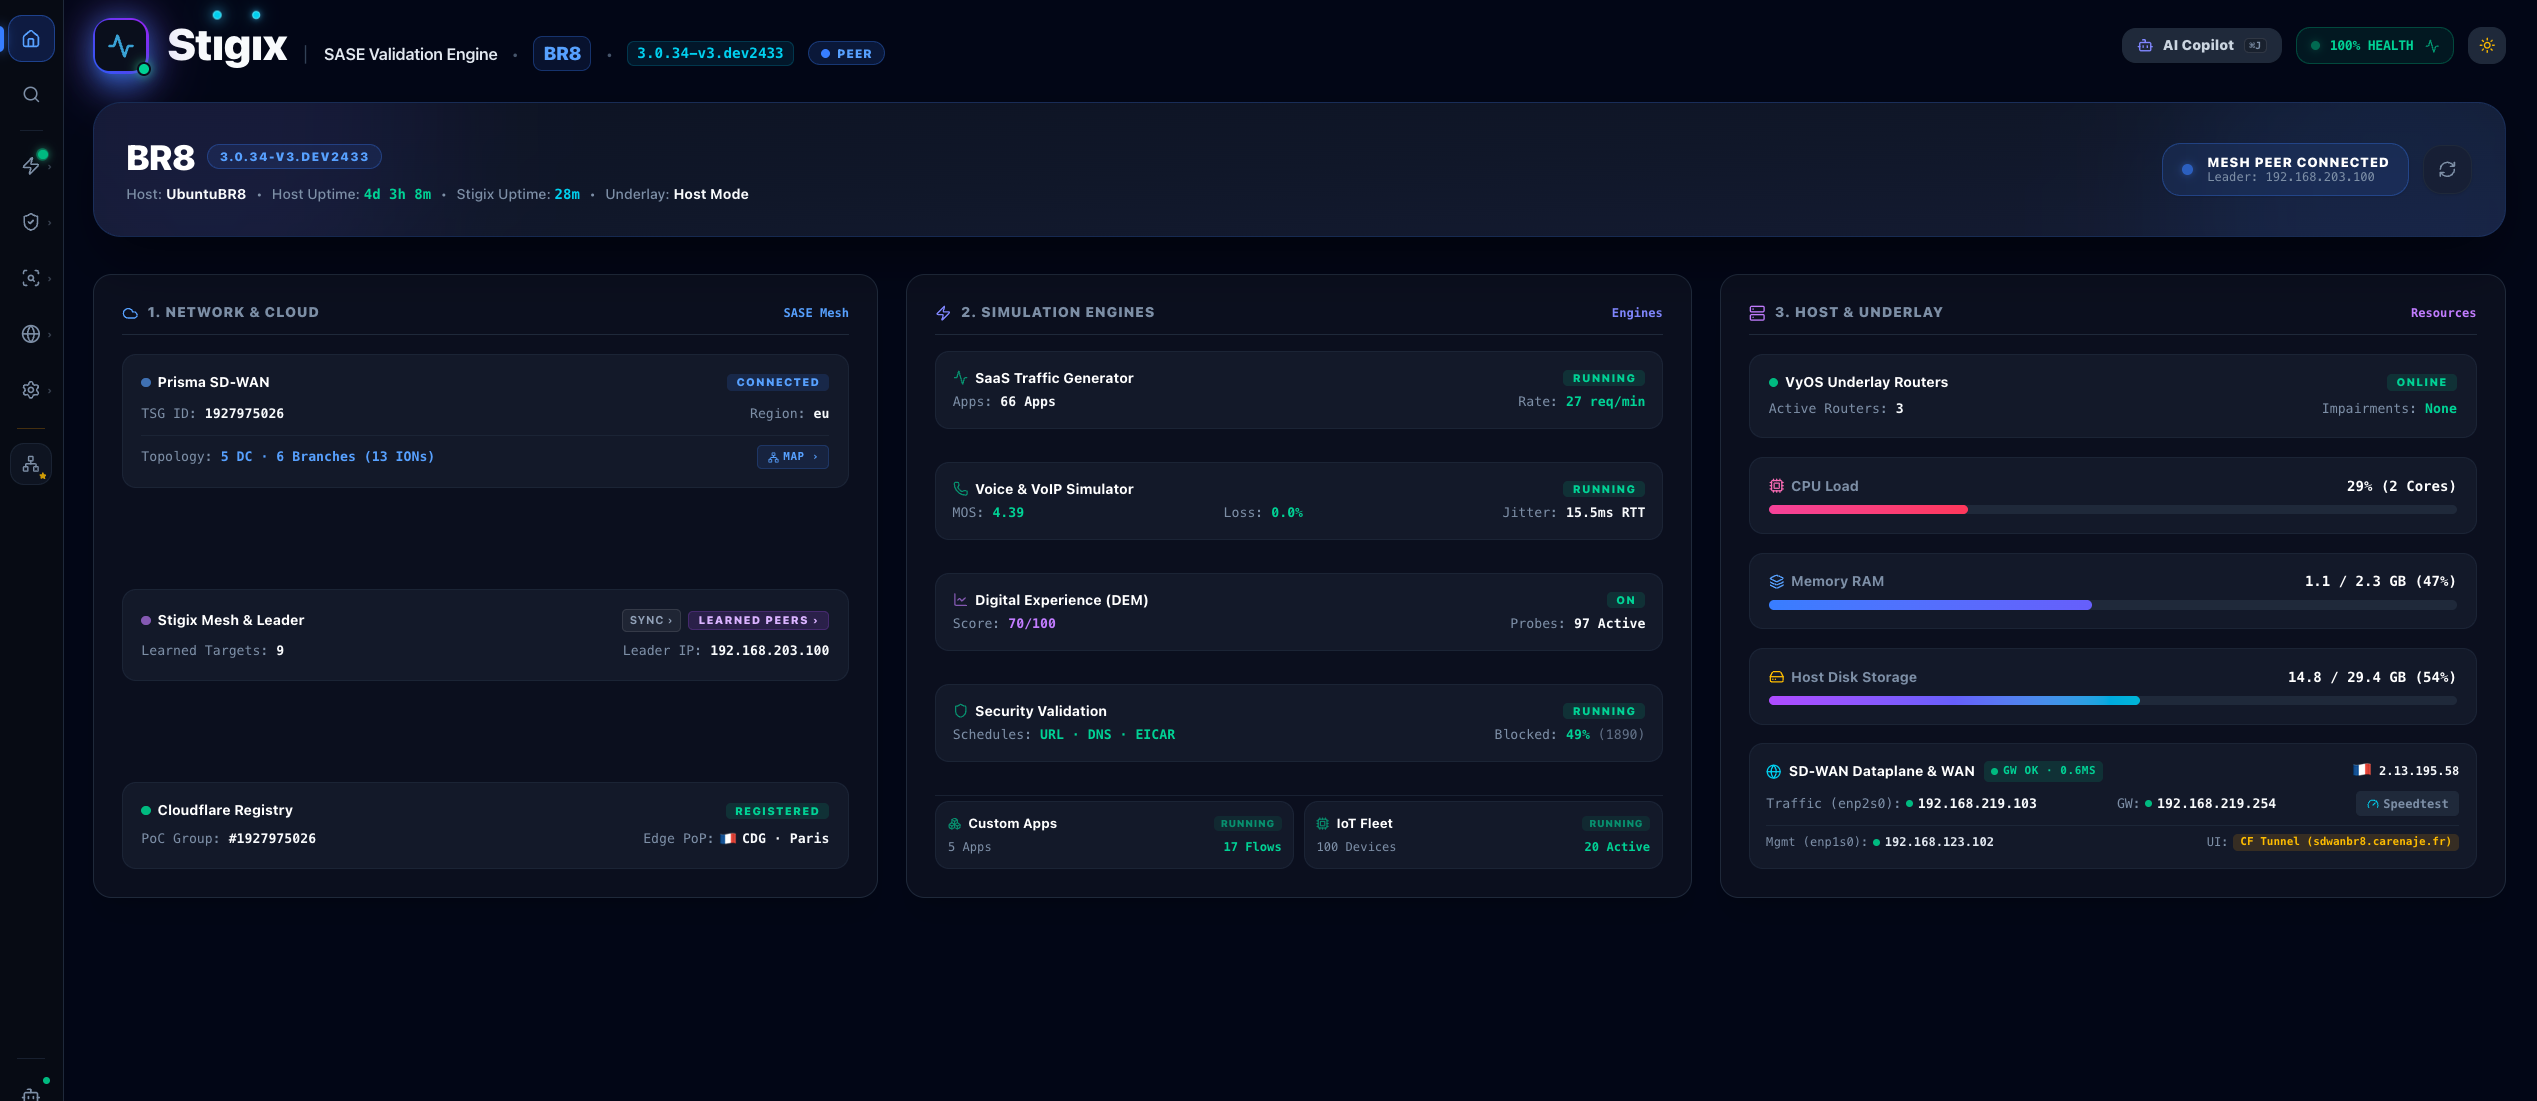
Command Center & SCM Rail
user experience
Strata Cloud Manager (SCM)-inspired vertical navigation across 6 operational domains with hash deep-linking and Light/Dark themes. The 3-column Home Command Center displays real-time health, active simulation engines, and cluster connectivity at a glance.
3-Col Cockpit SCM Rail Deep-Linking Dark/Light
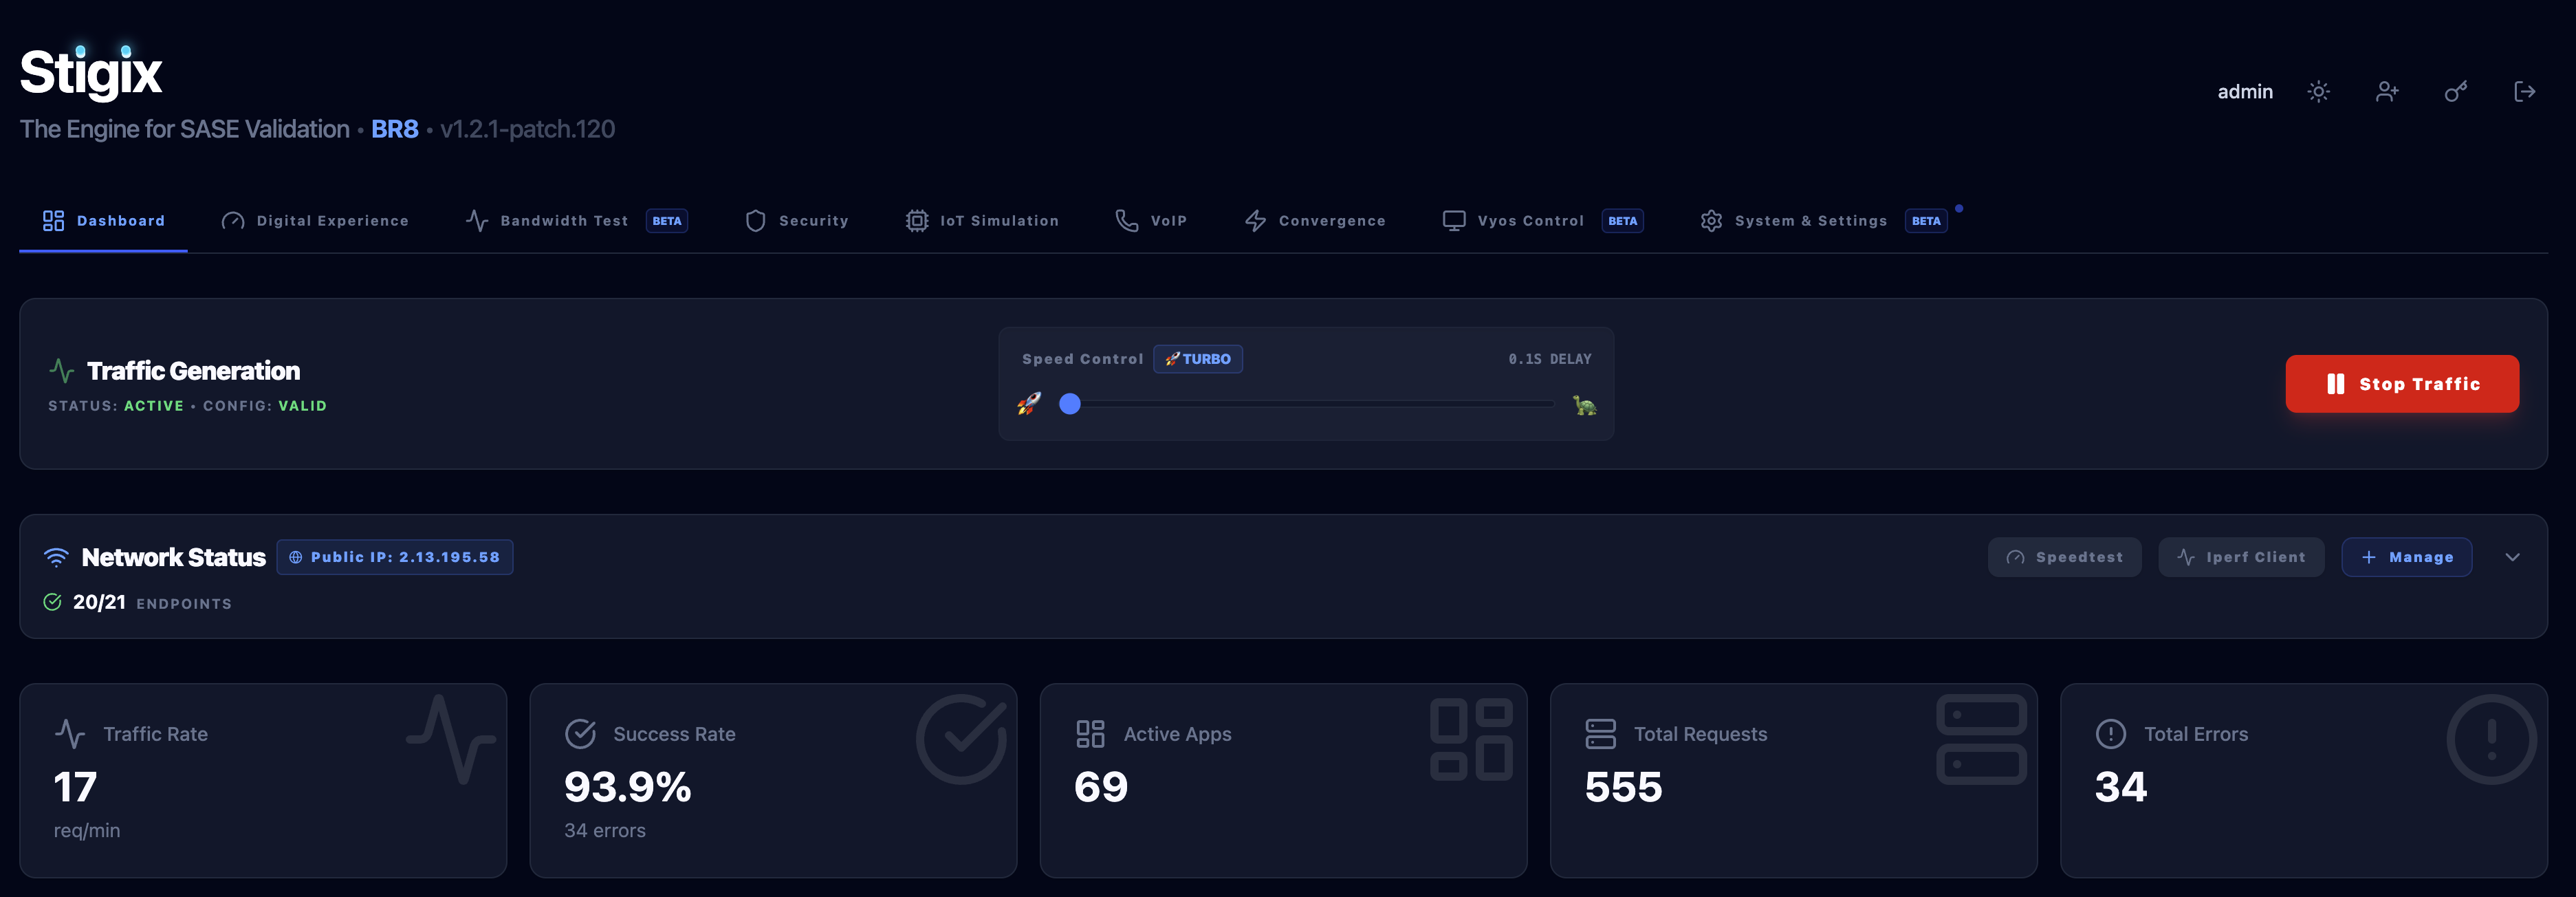
SaaS Traffic & Digital Experience
traffic · dem monitoring
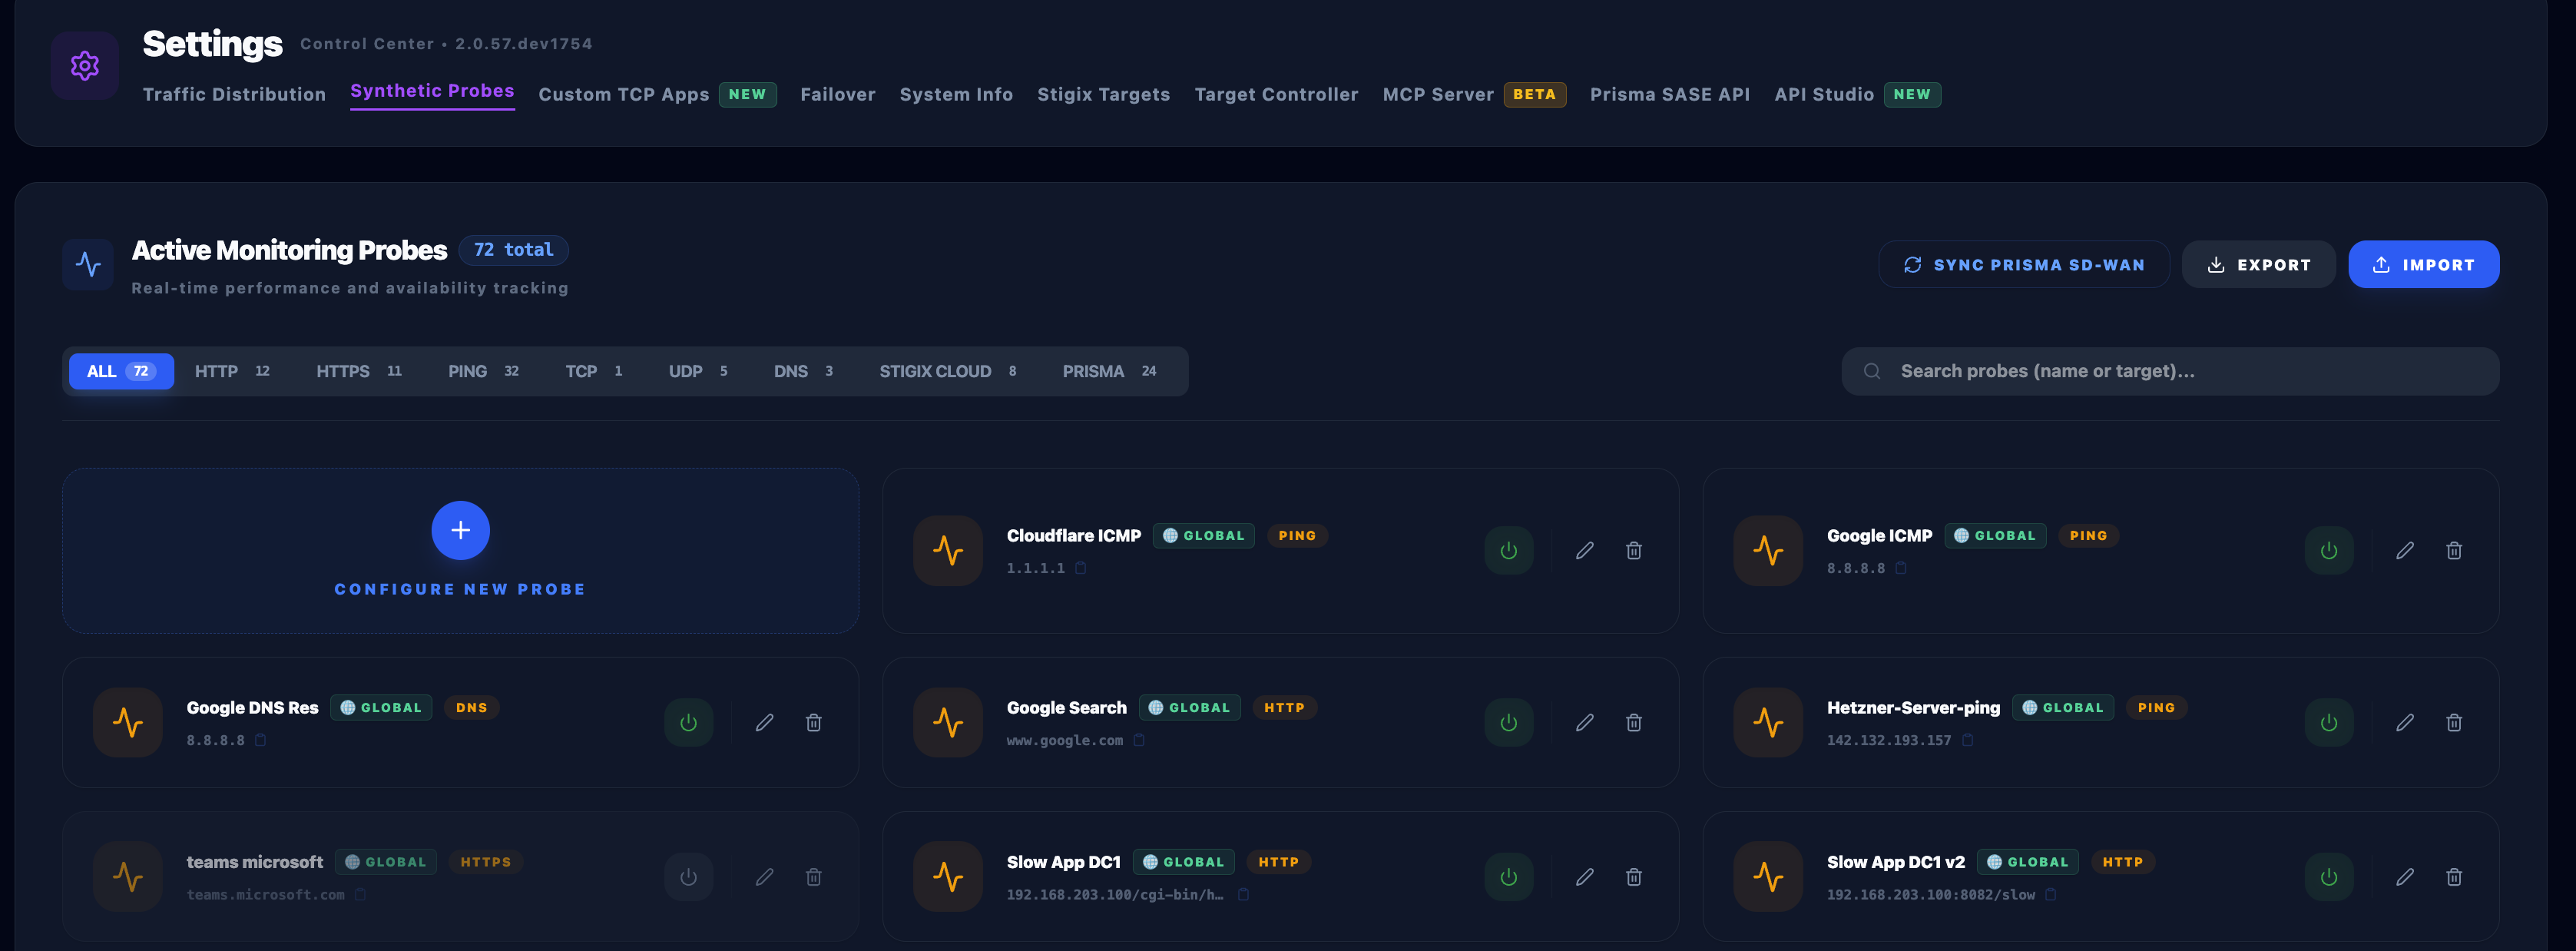
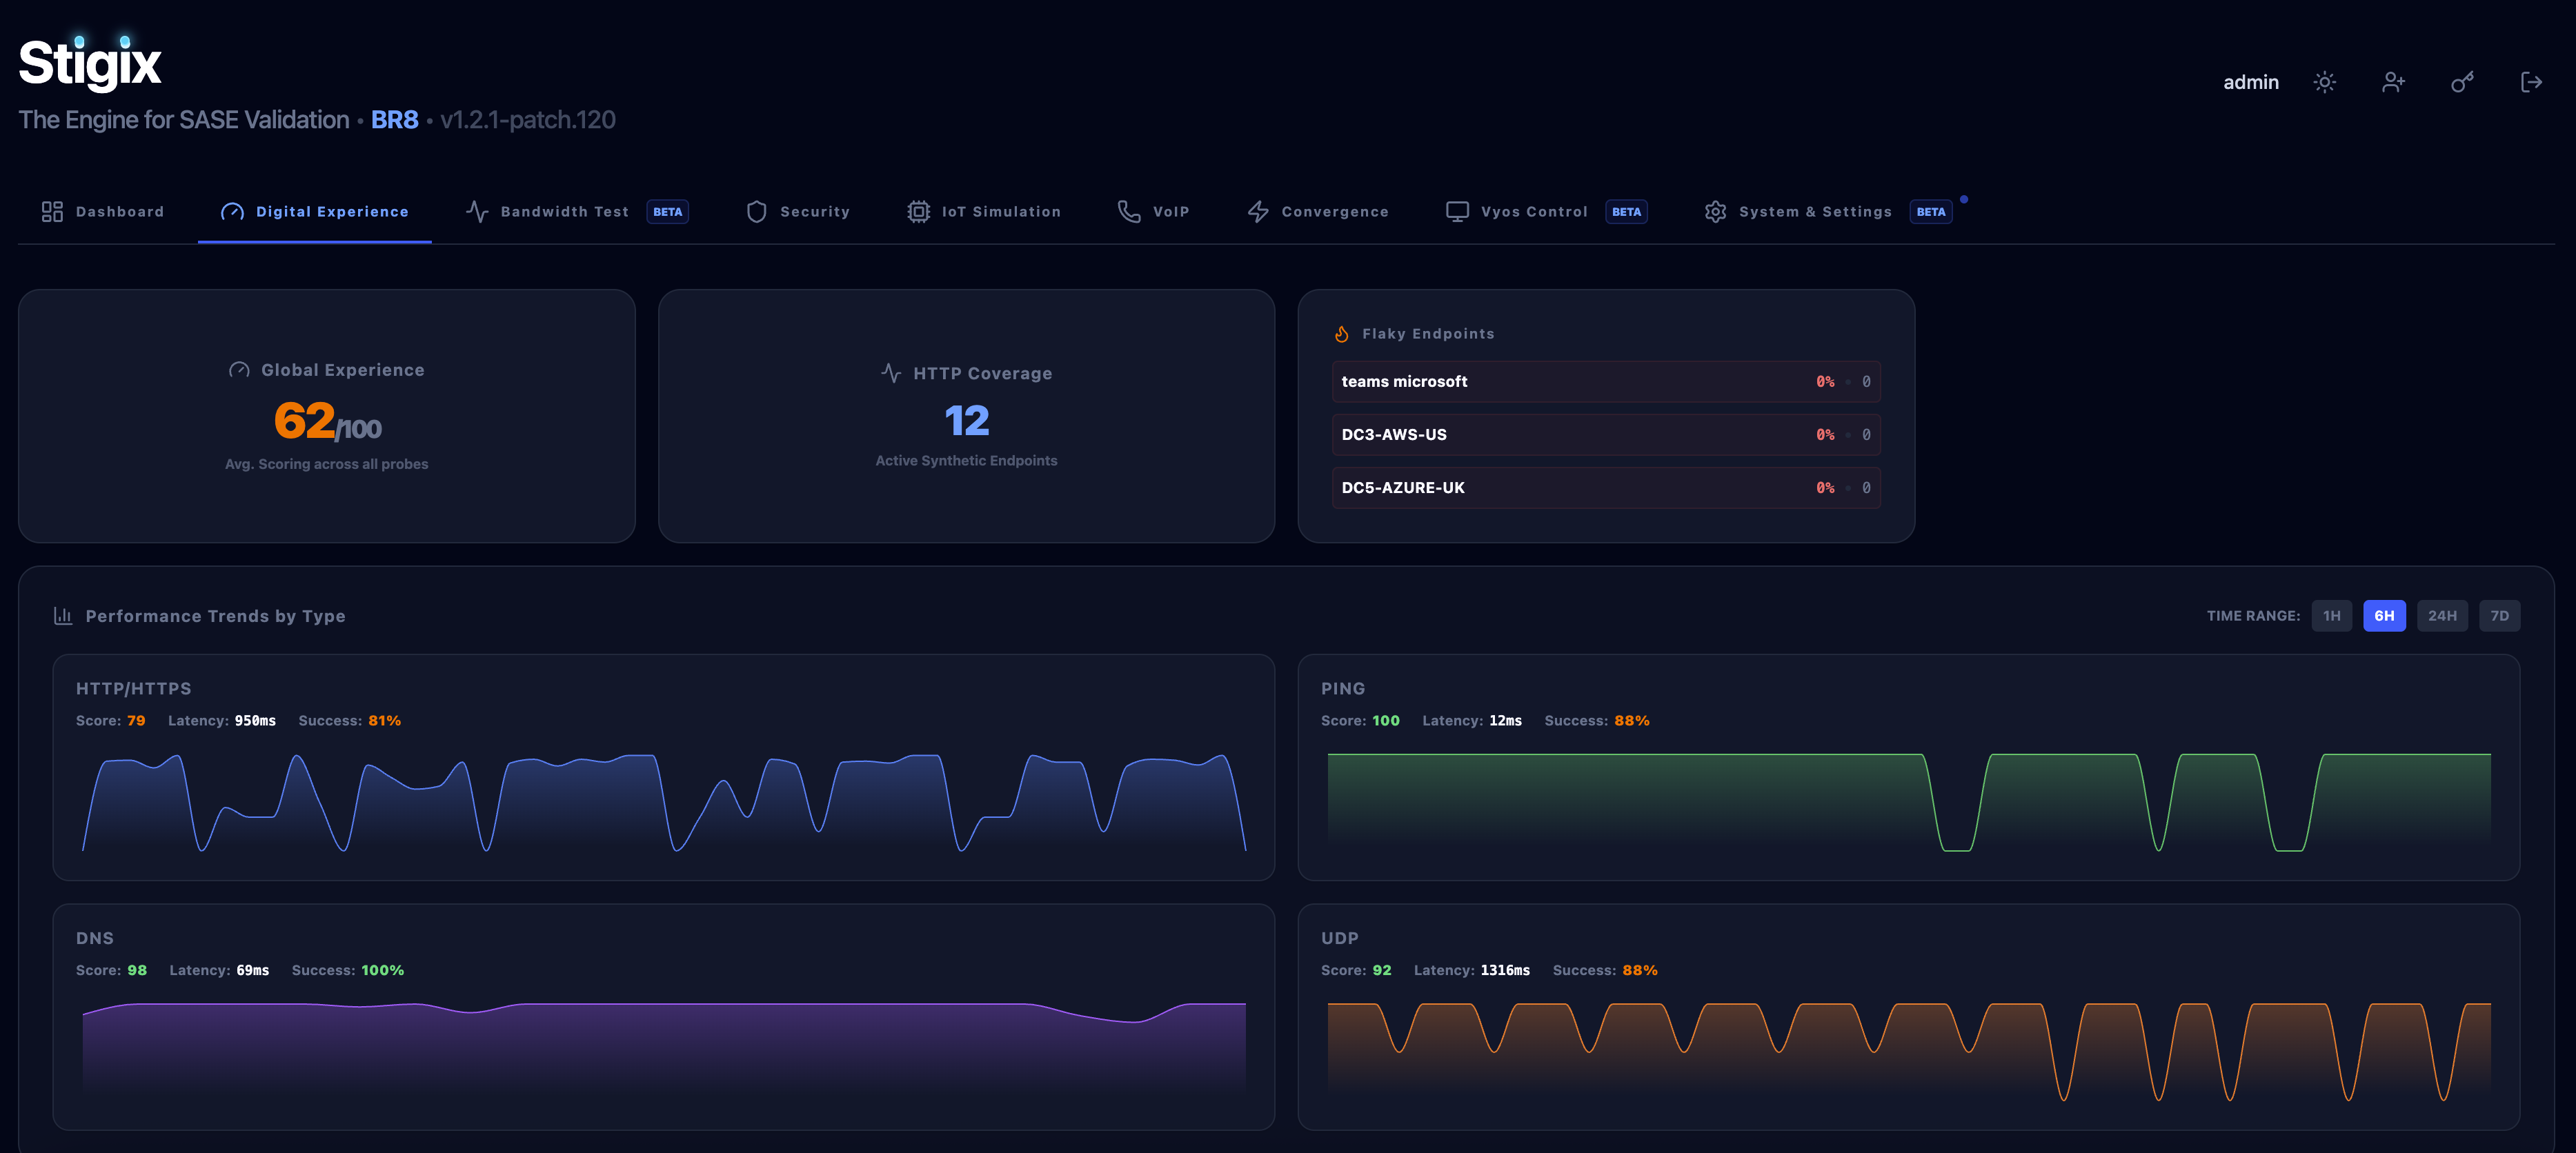
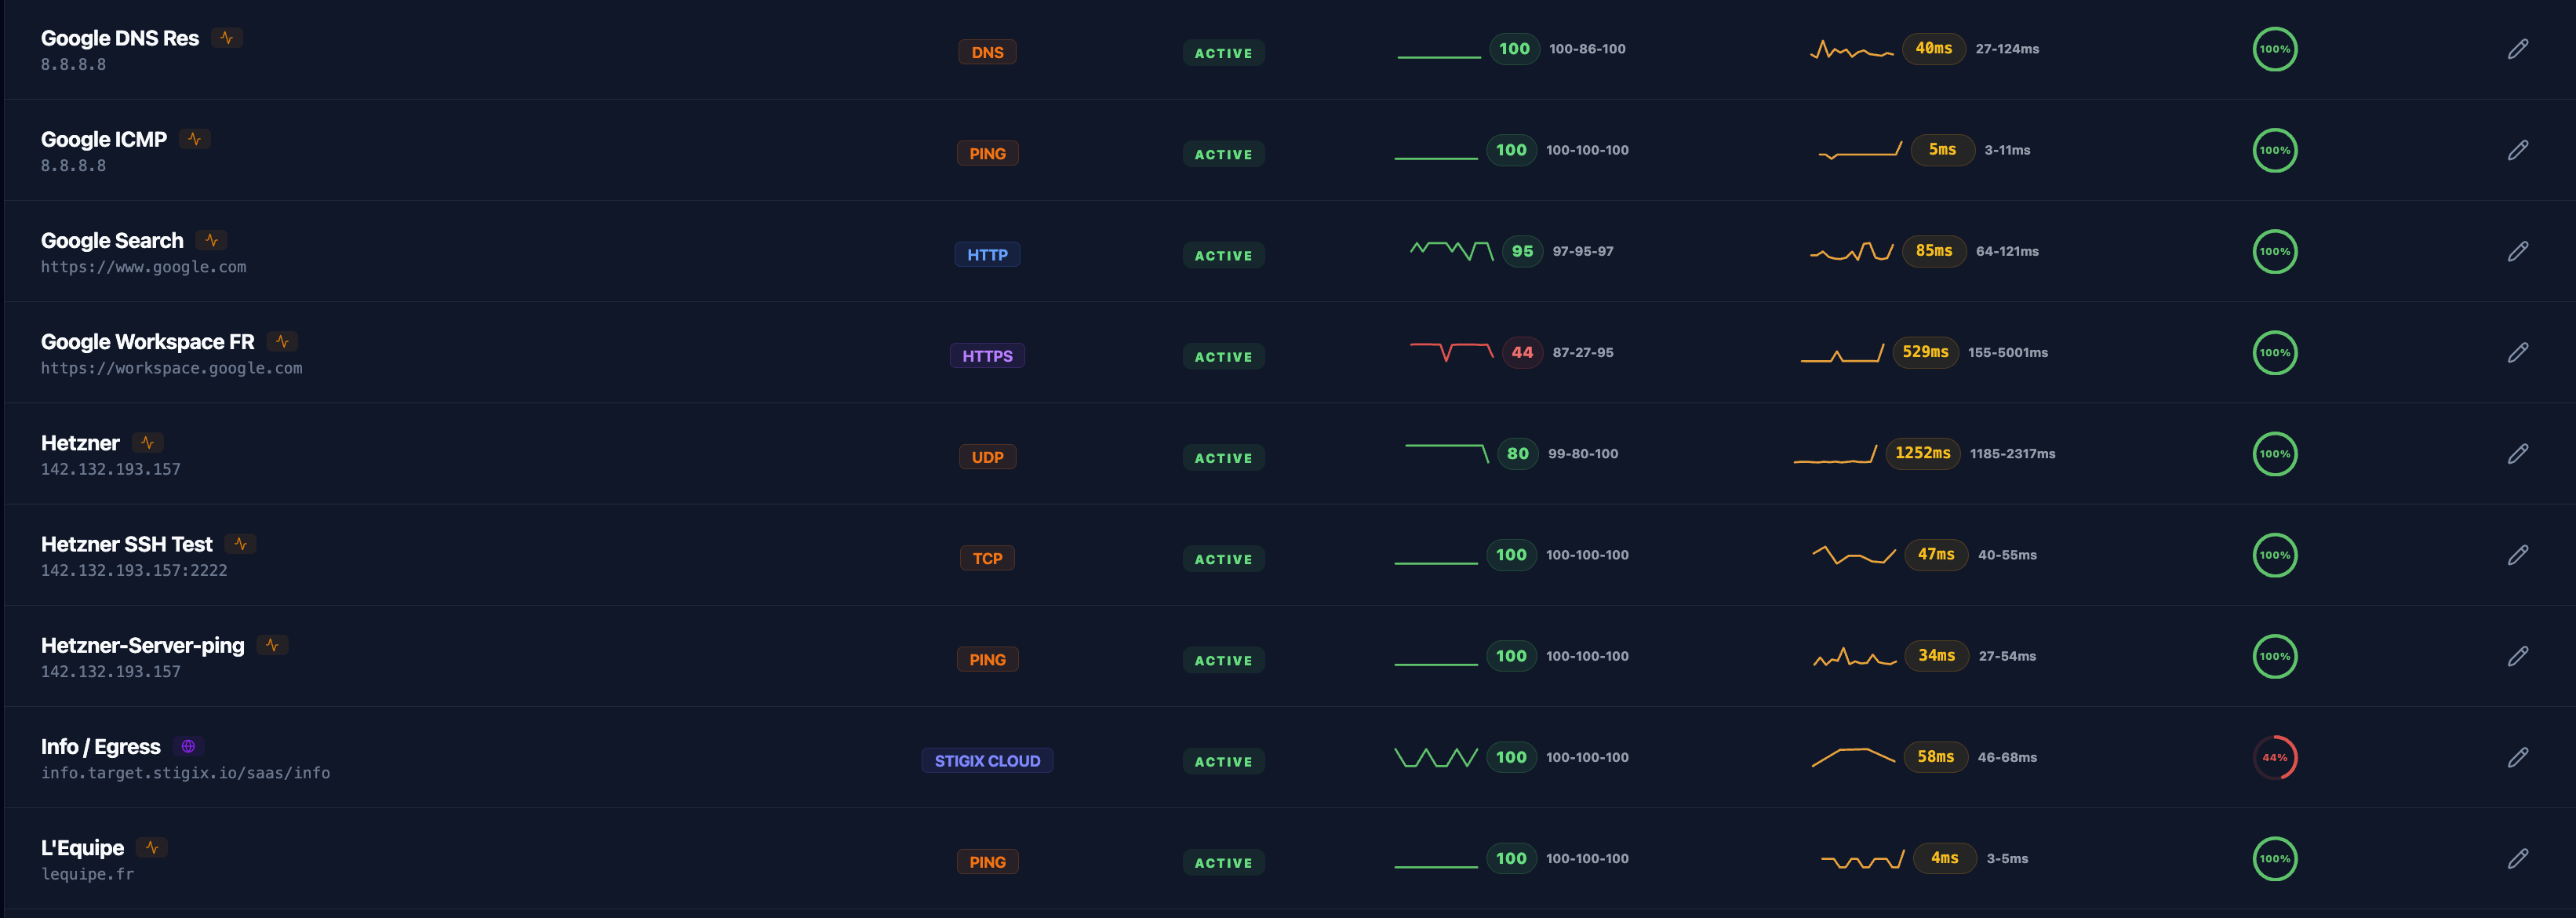
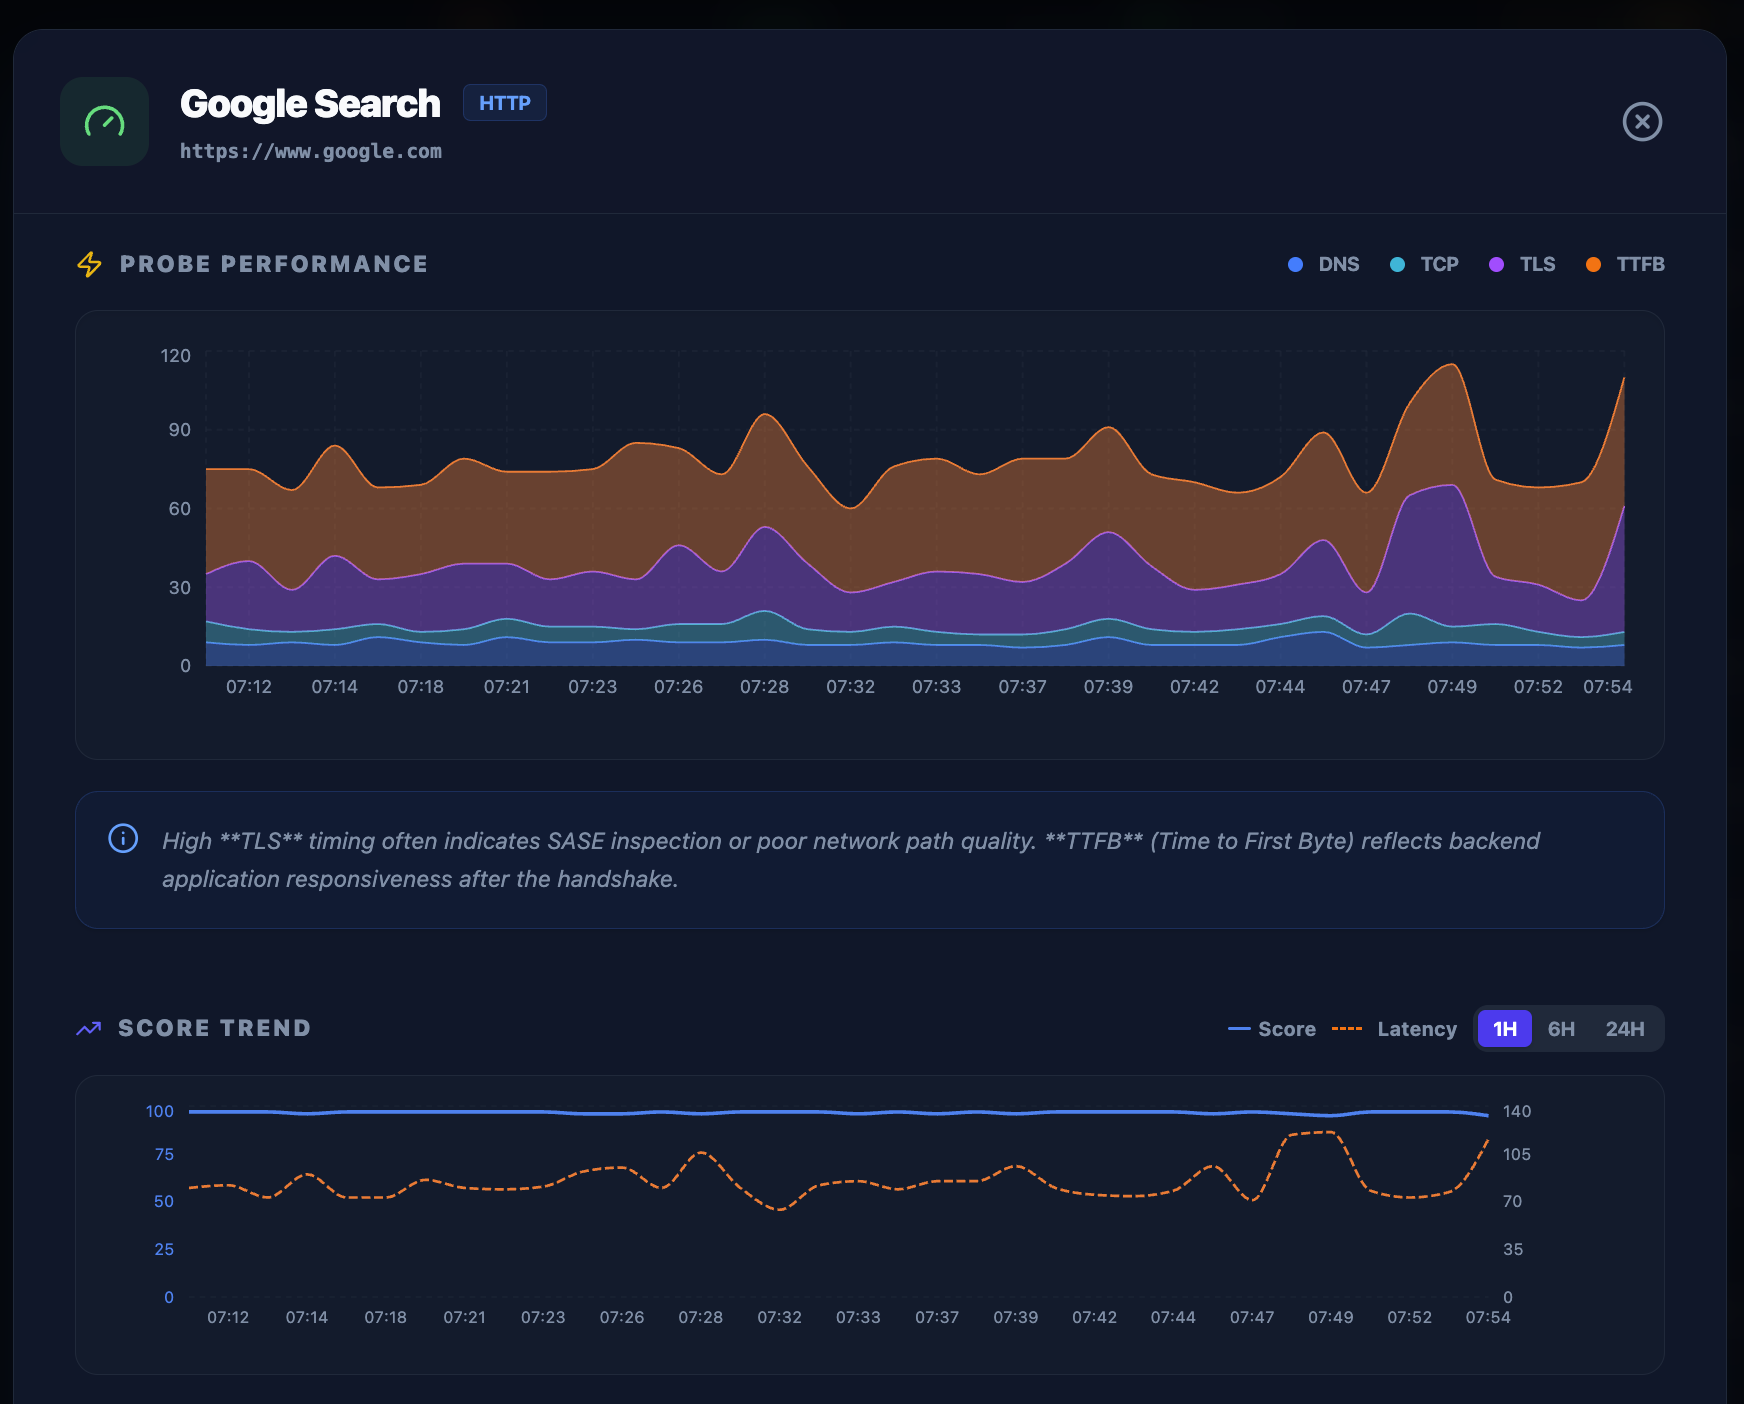
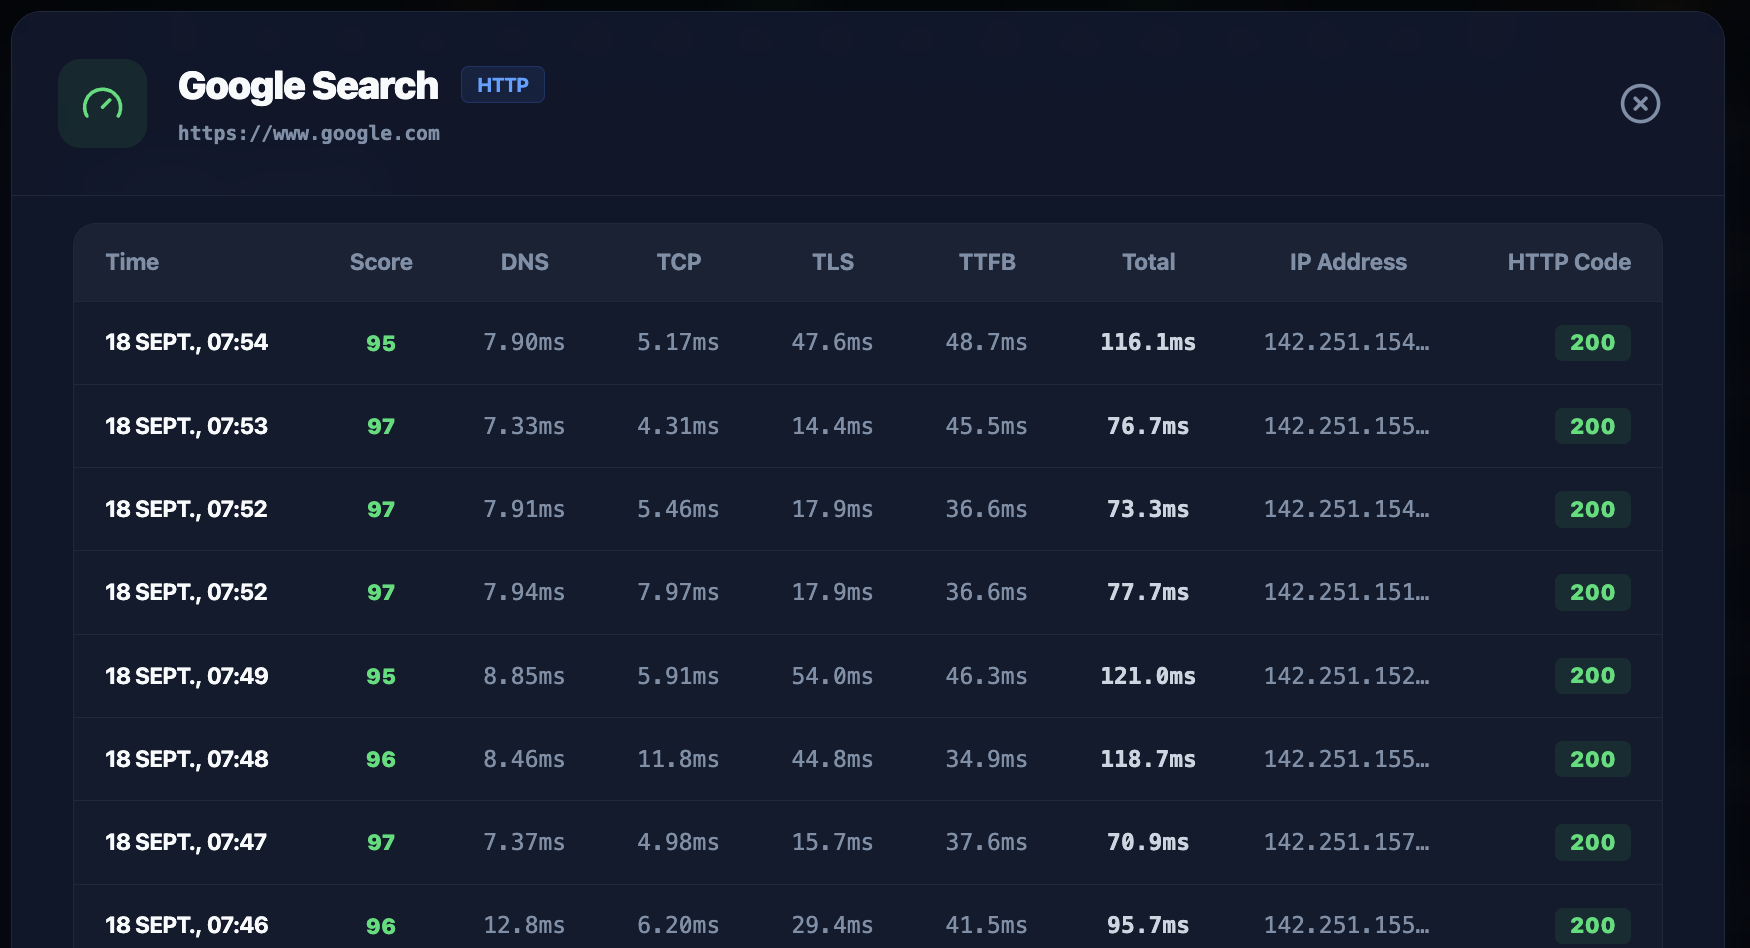
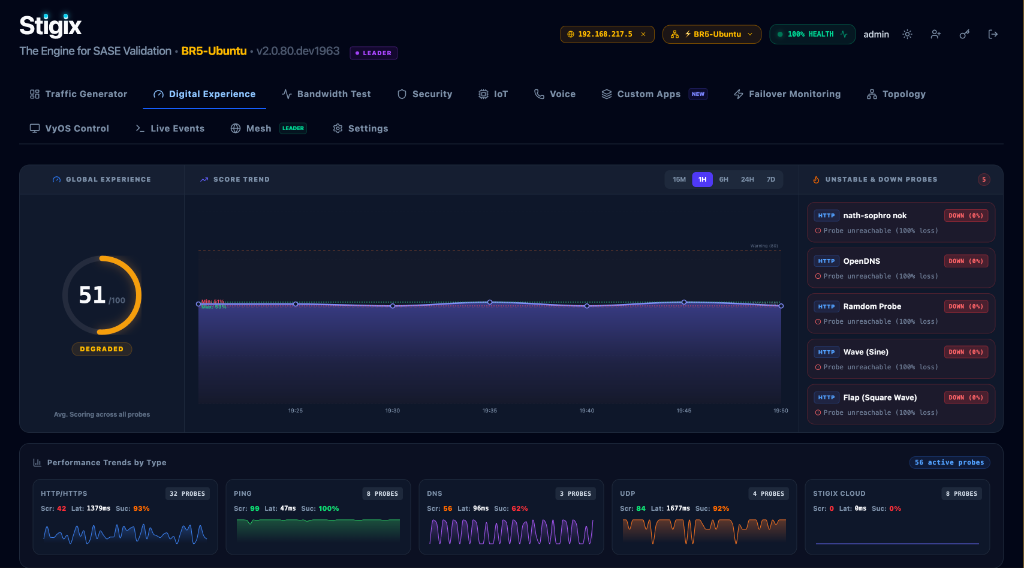
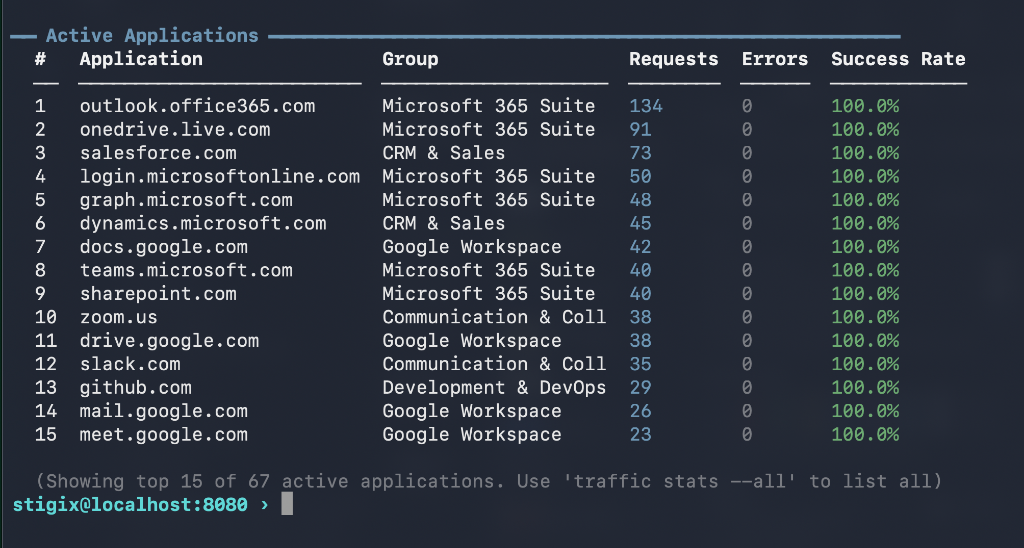
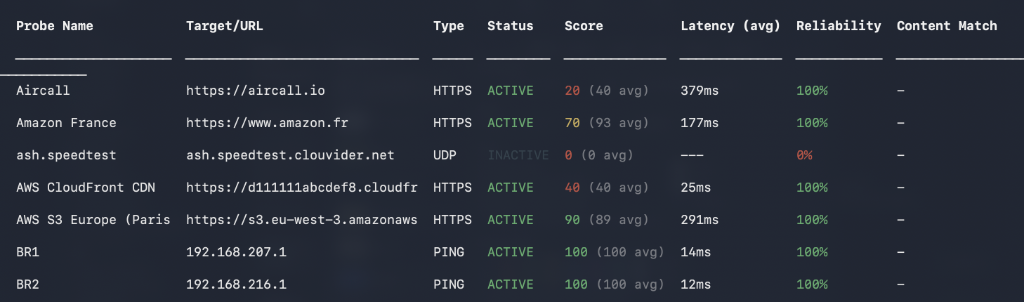
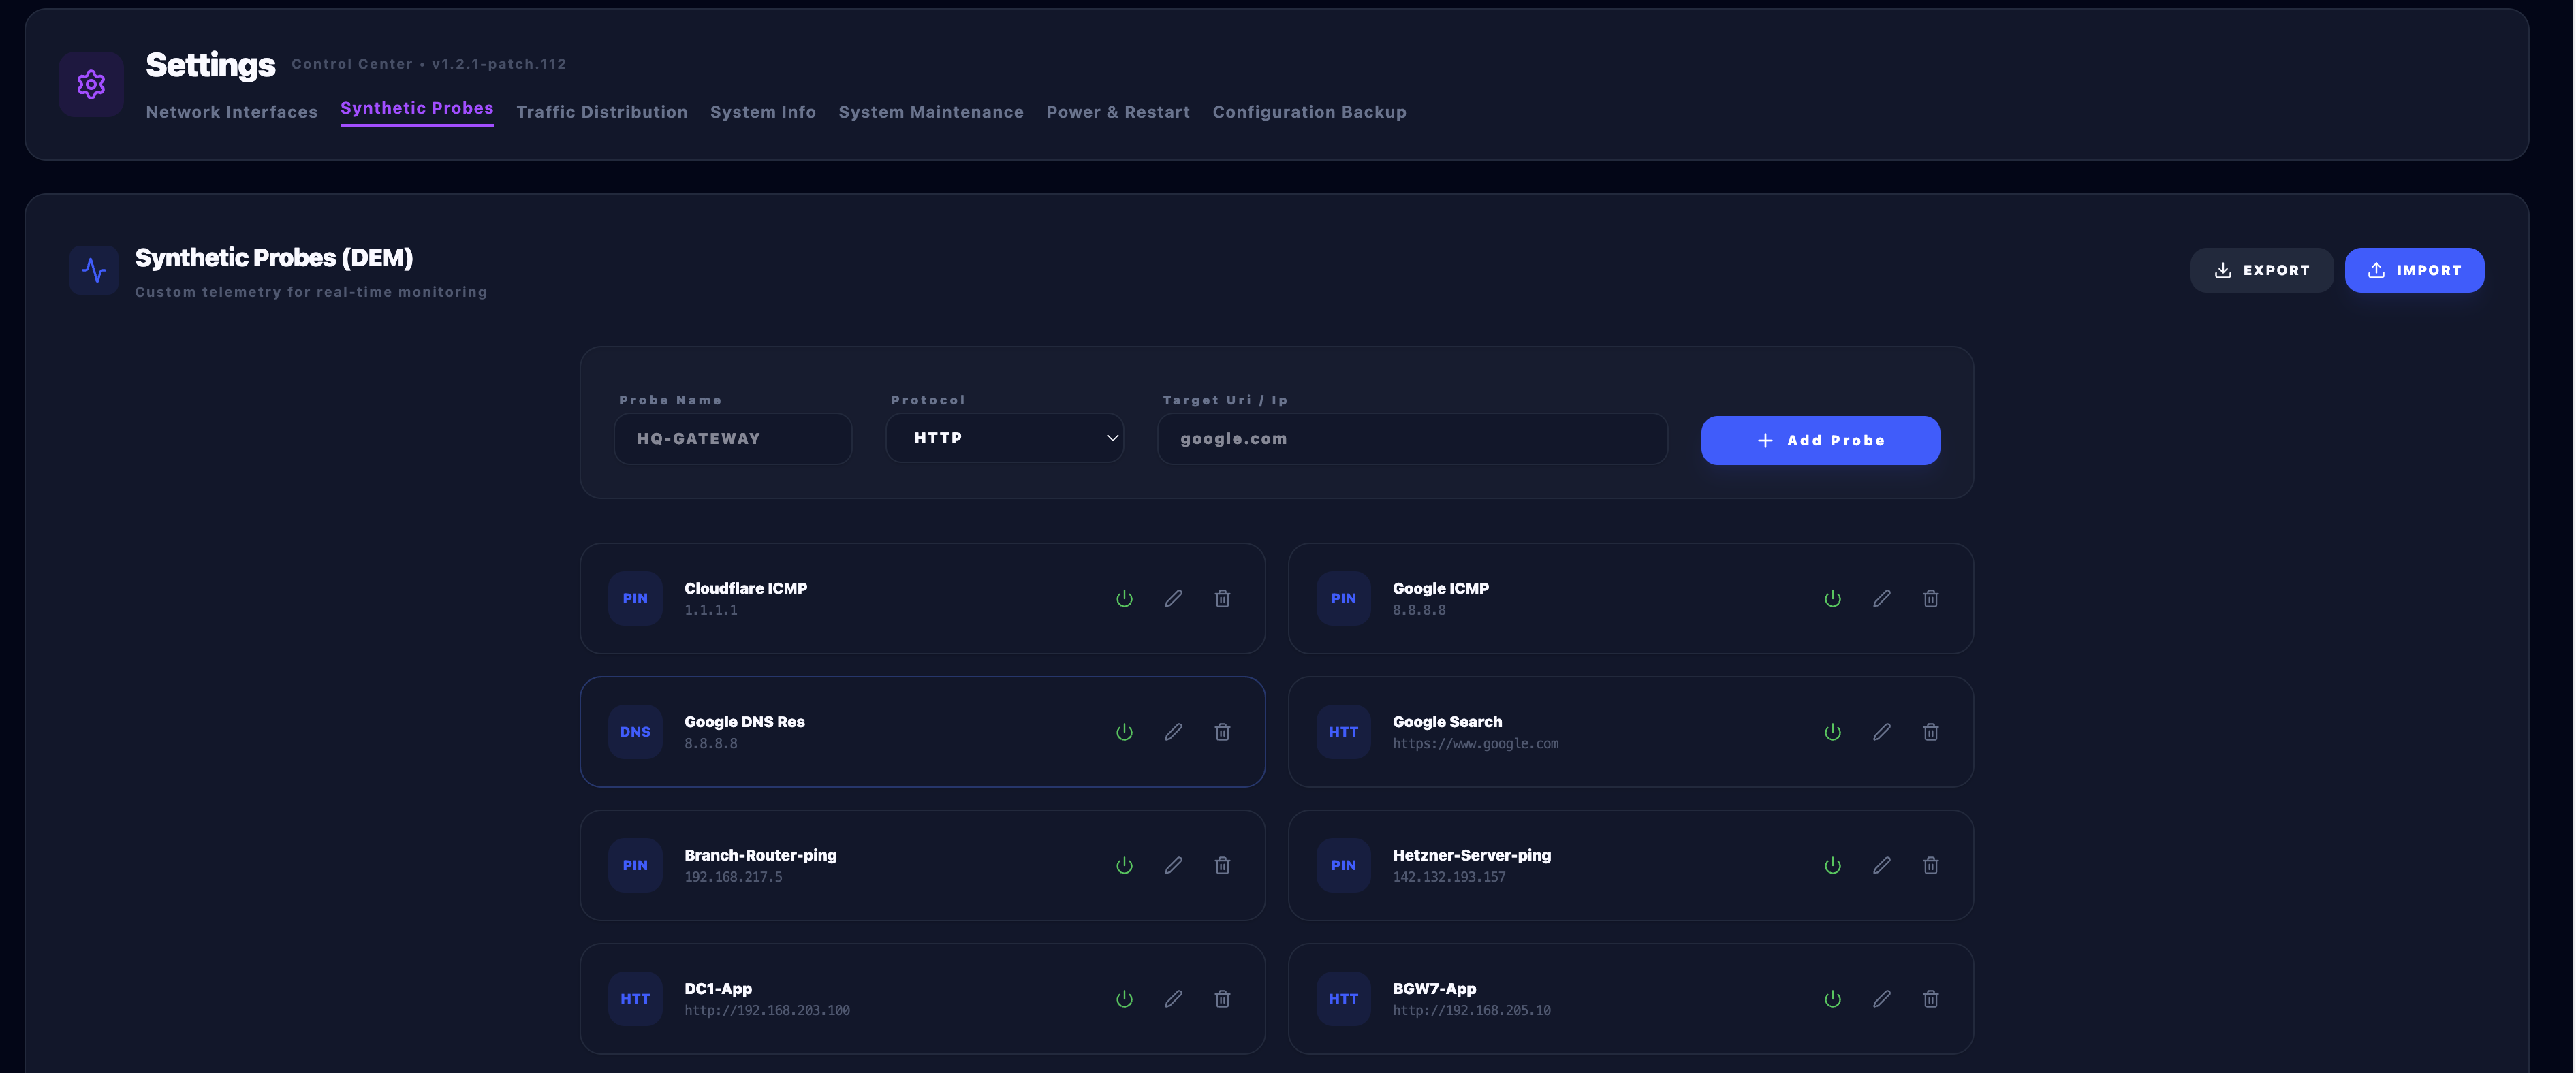
Generates weighted HTTP/S traffic across 68 enterprise SaaS apps (M365, Salesforce, Google, Zoom) alongside continuous HTTP, ICMP, DNS, and TCP synthetic probes. Tracks DNS/TCP/TLS/TTFB latency breakdowns with a sub-200ms in-memory ring buffer and 7-day JSONL history.
68 SaaS Apps HTTP/ICMP/TCP TTFB Breakdown Standby Mode
Custom TCP Applications
east-west · application chaos
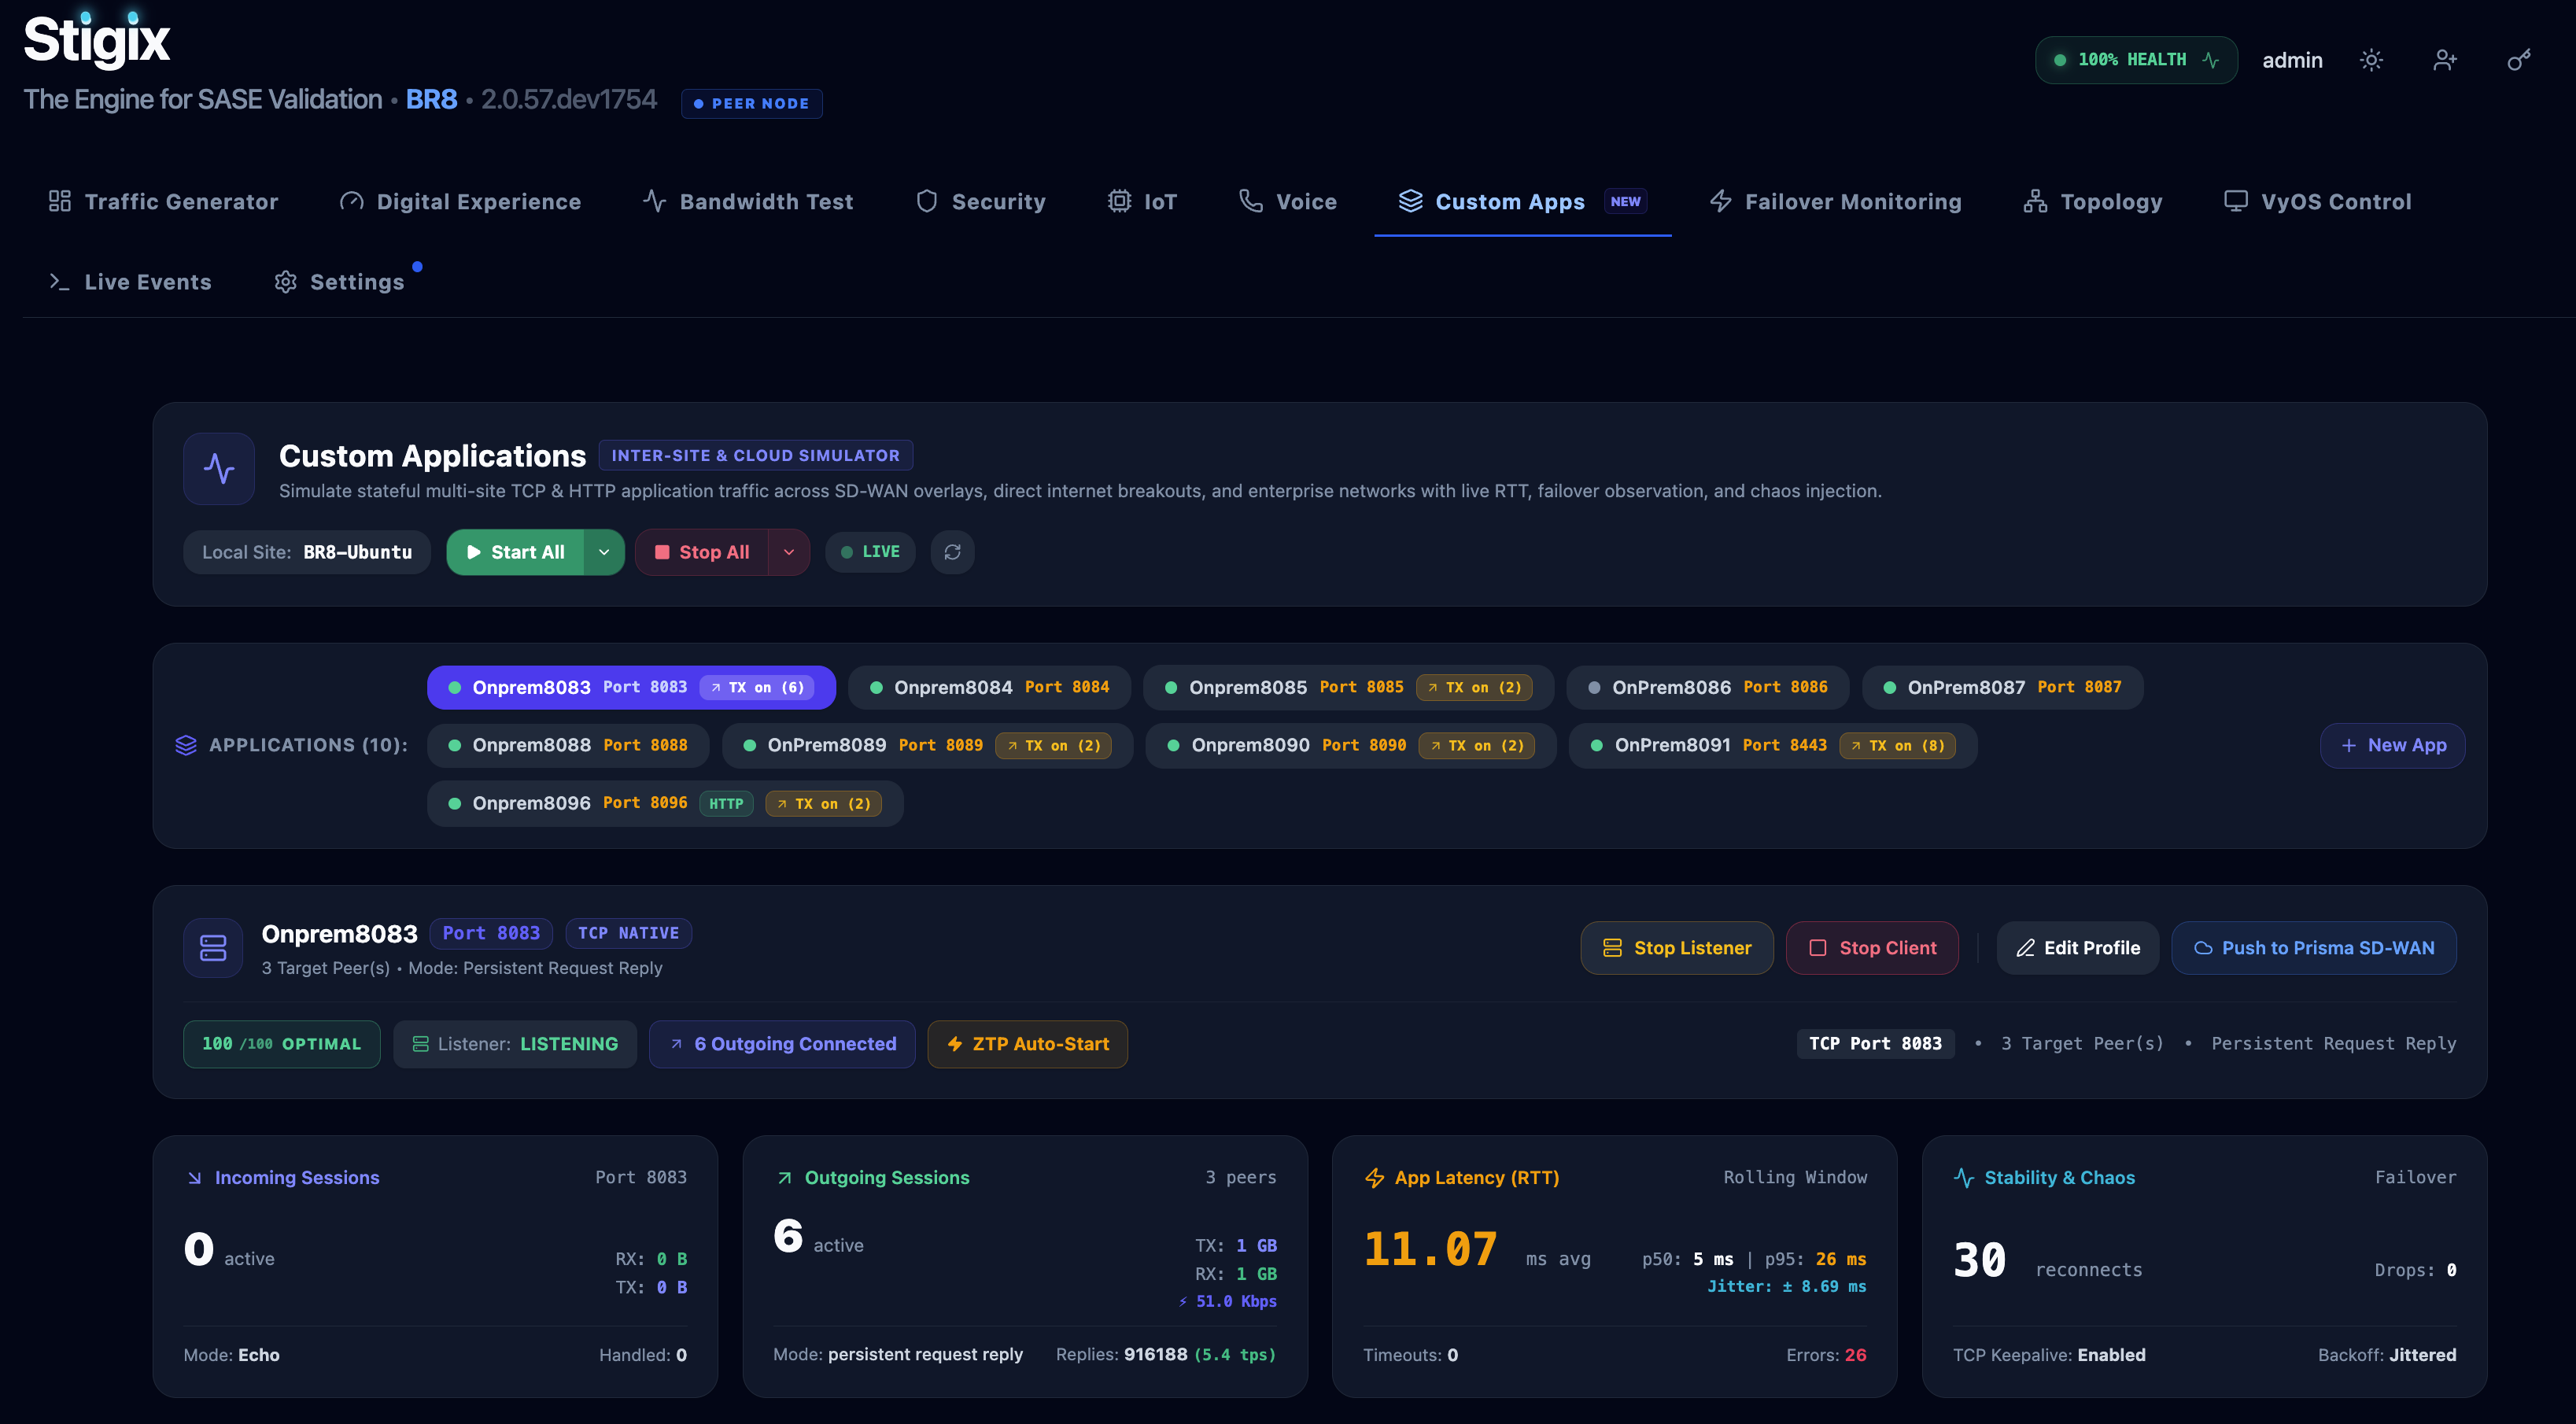
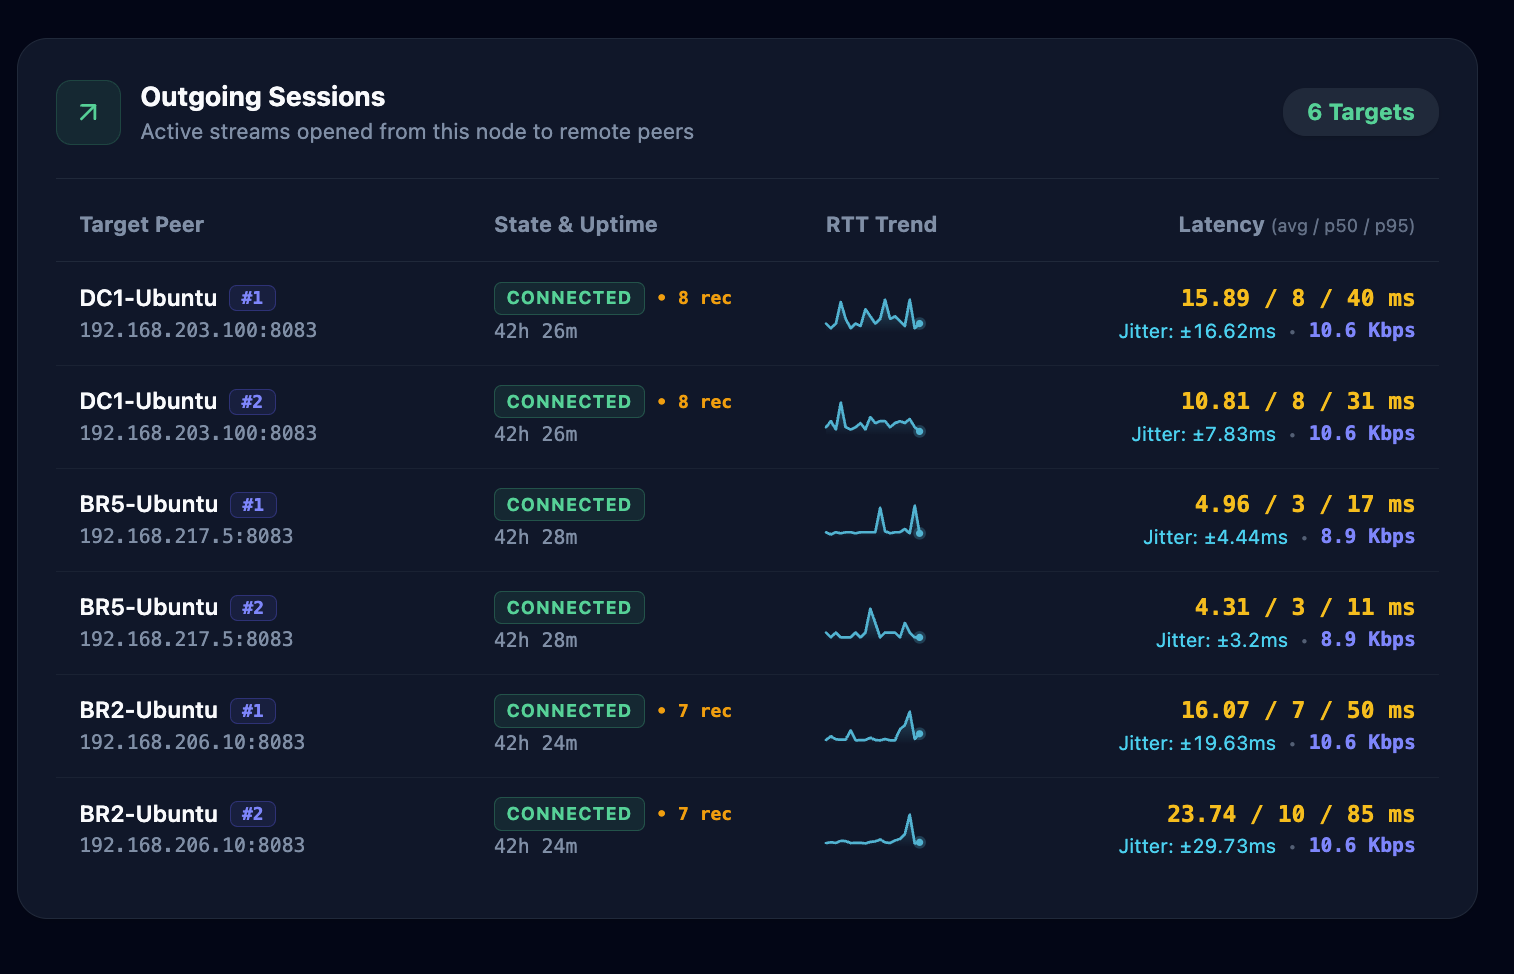
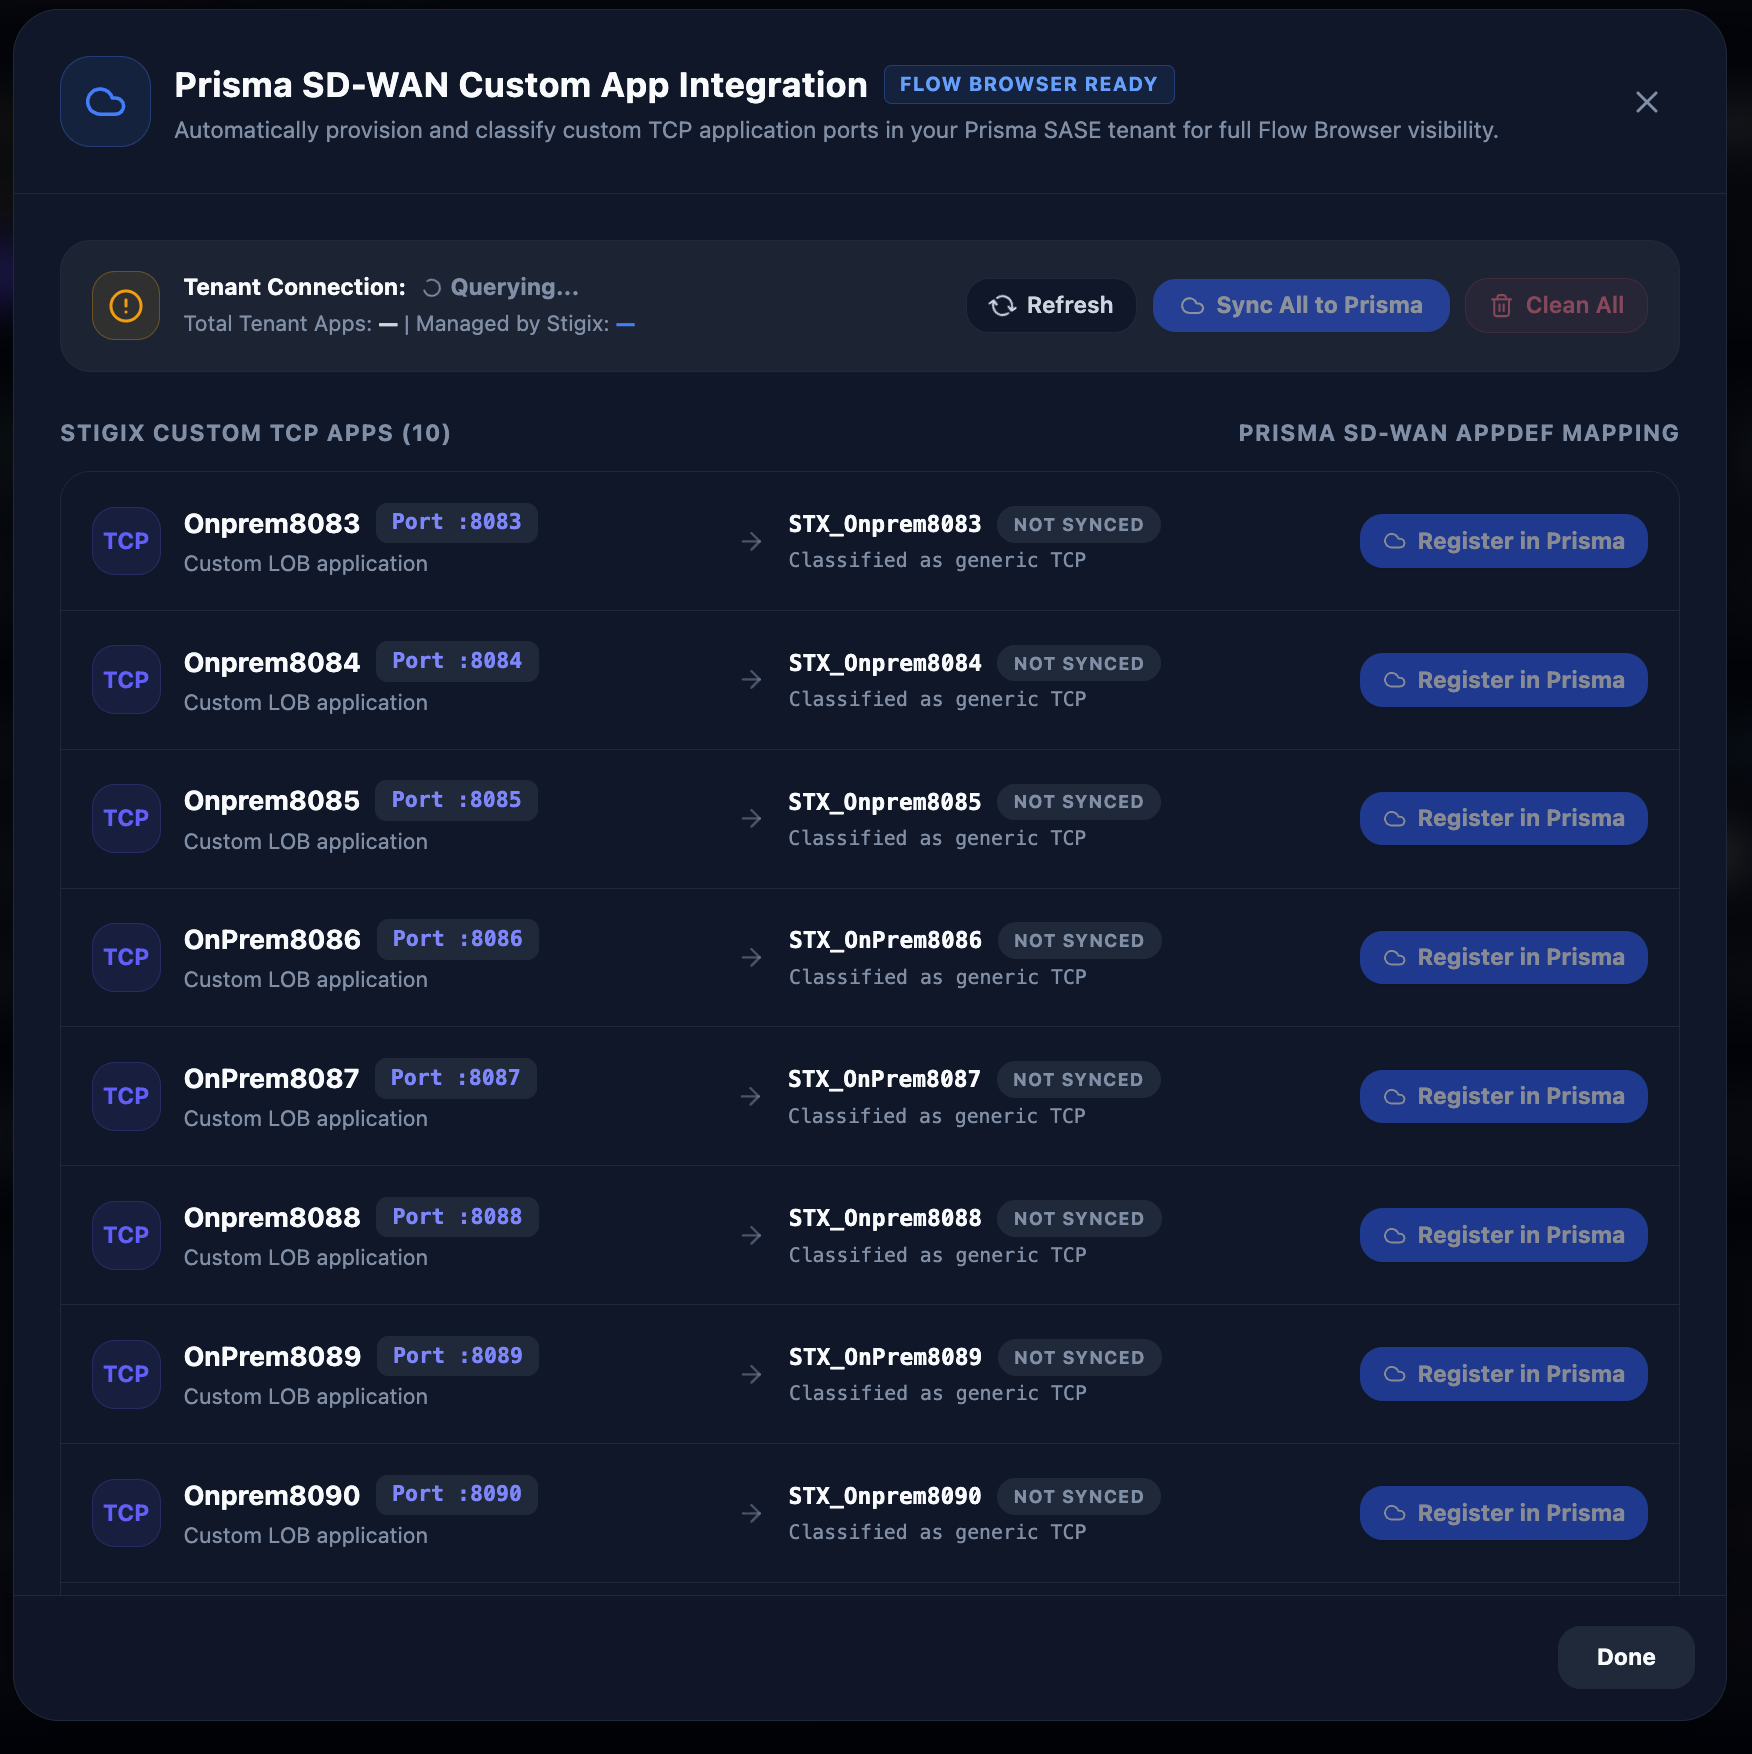
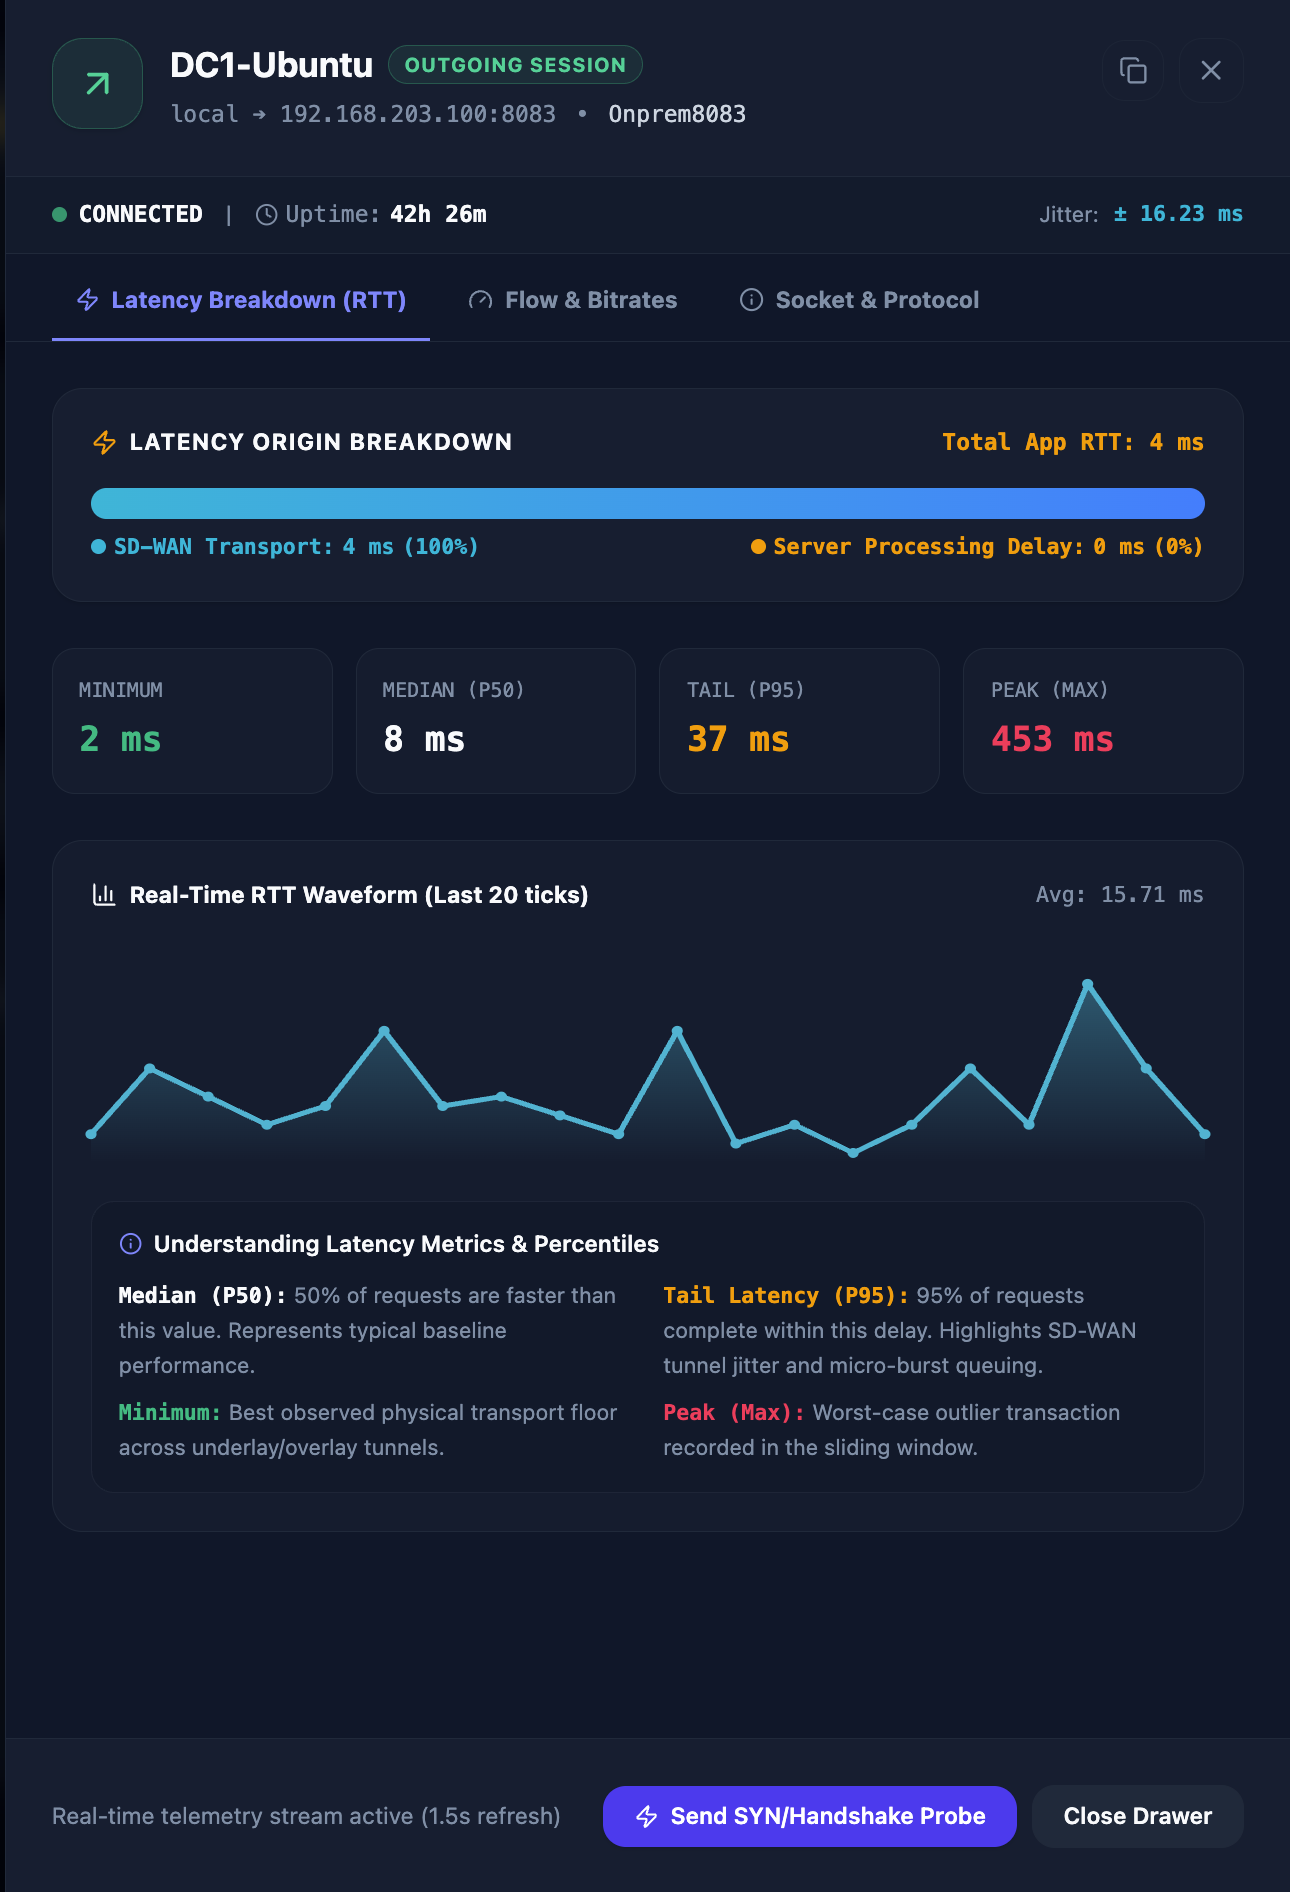
Dual-role East-West TCP listeners and client workload generators with 8 server chaos modes (echo, fixed/jittered delay, looping degradation, drops, TCP RST, app errors). Isolates Network RTT vs Server Response Time ($p50/p95$) and syncs custom AppDefs to Prisma SD-WAN in 1 click.
East-West TCP 8 Chaos Modes RTT vs SRT Prisma AppDef Sync
SD-WAN Multicast Overlay NEW
multicast · igmpv3 / pim-sm
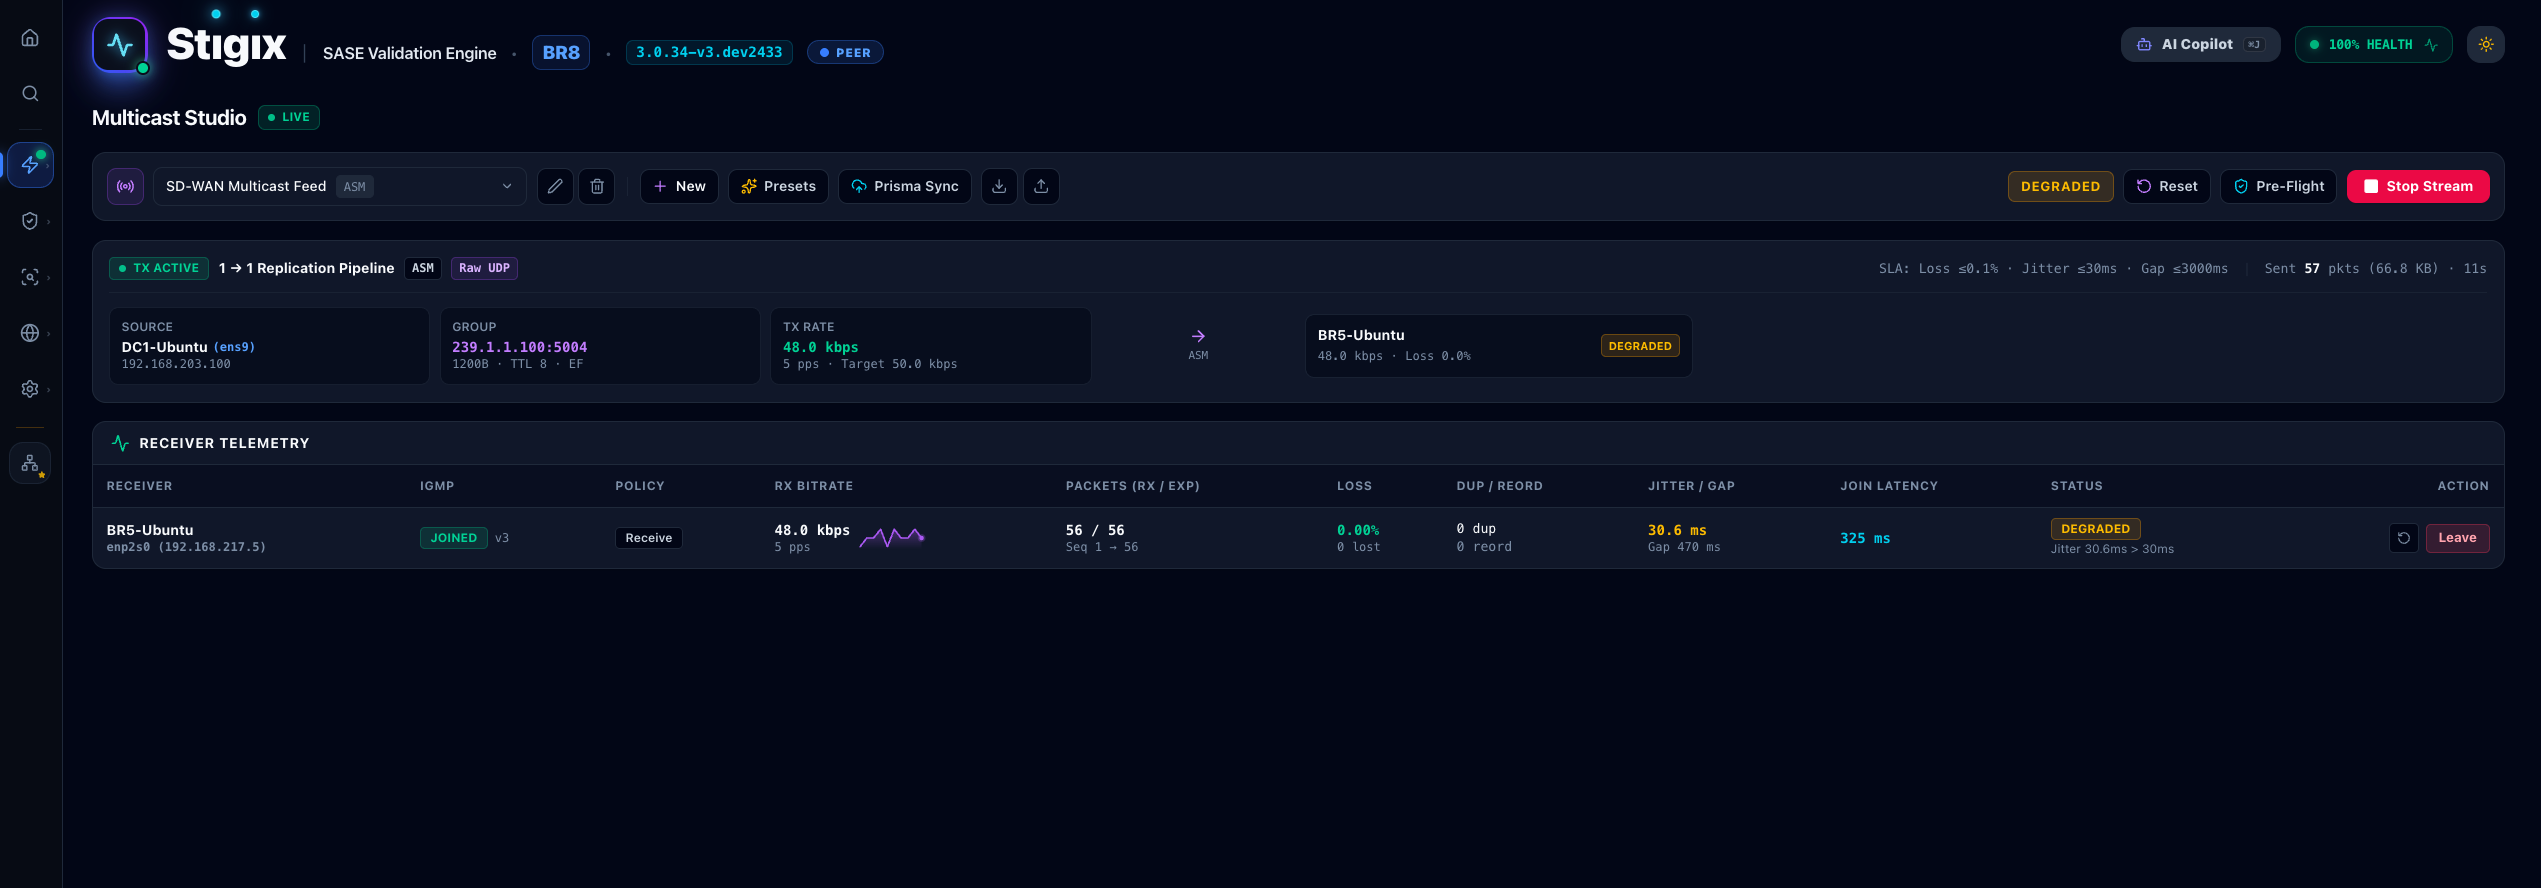
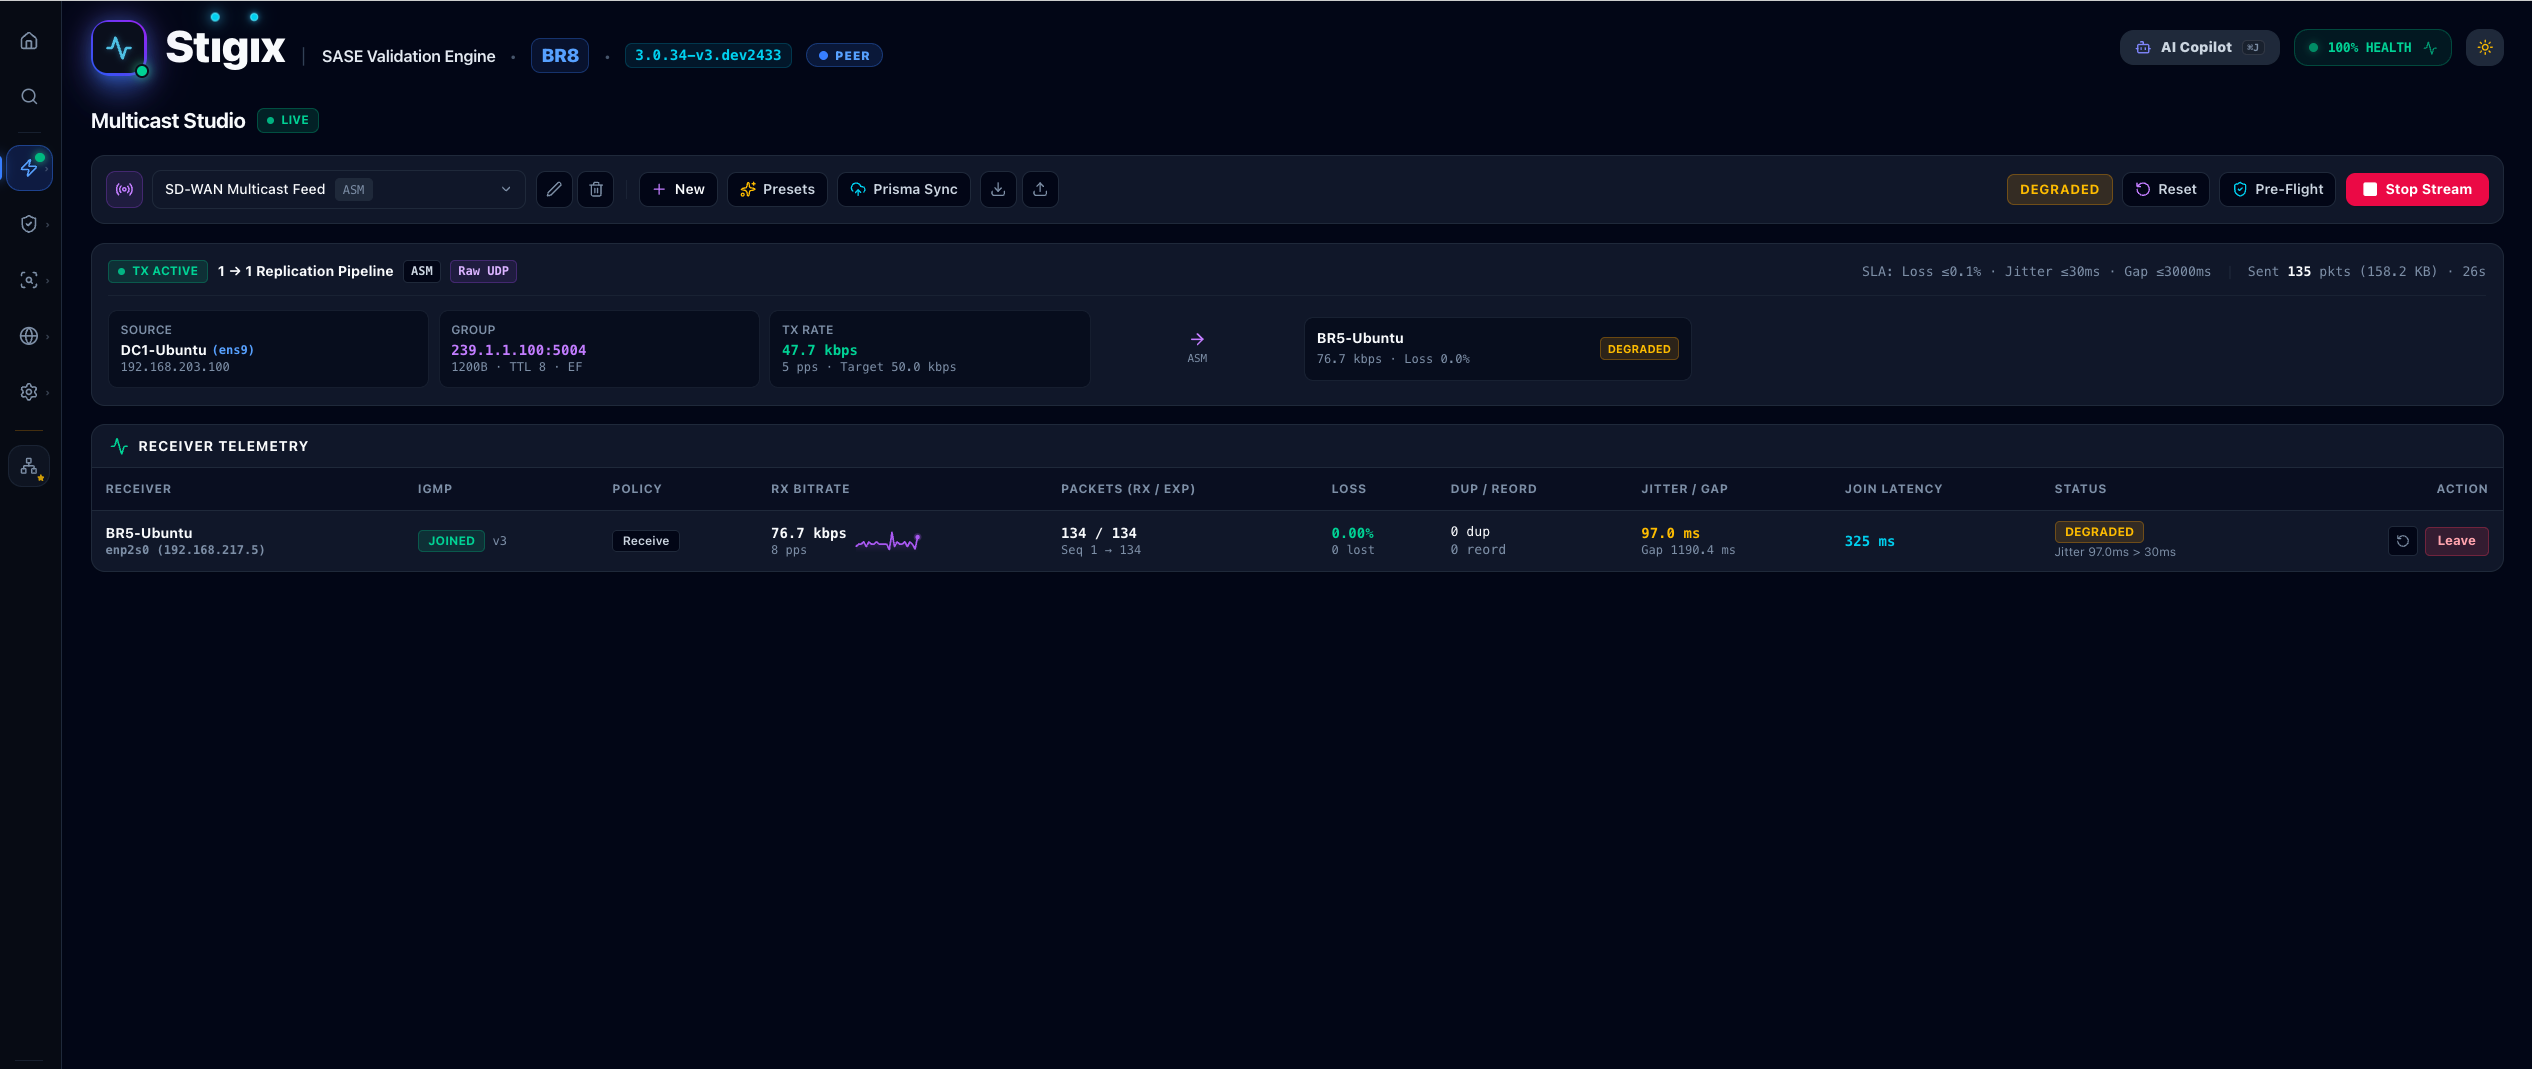
Validates end-to-end multicast replication across SD-WAN overlays with real IGMPv3/v2 Membership Reports, configurable TTL and DSCP marking (EF/AF41/CS4), and multi-group RTP/UDP streams. Correlates sender emission rates with receiver sequence gap detection, RFC 3550 jitter, and blackhole diagnostics.
IGMPv3 / PIM-SM Multi-Group DSCP / TTL Gap & Jitter Audit
Live Capture & PCAP Replay NEW
web wireshark · sase l7 replay
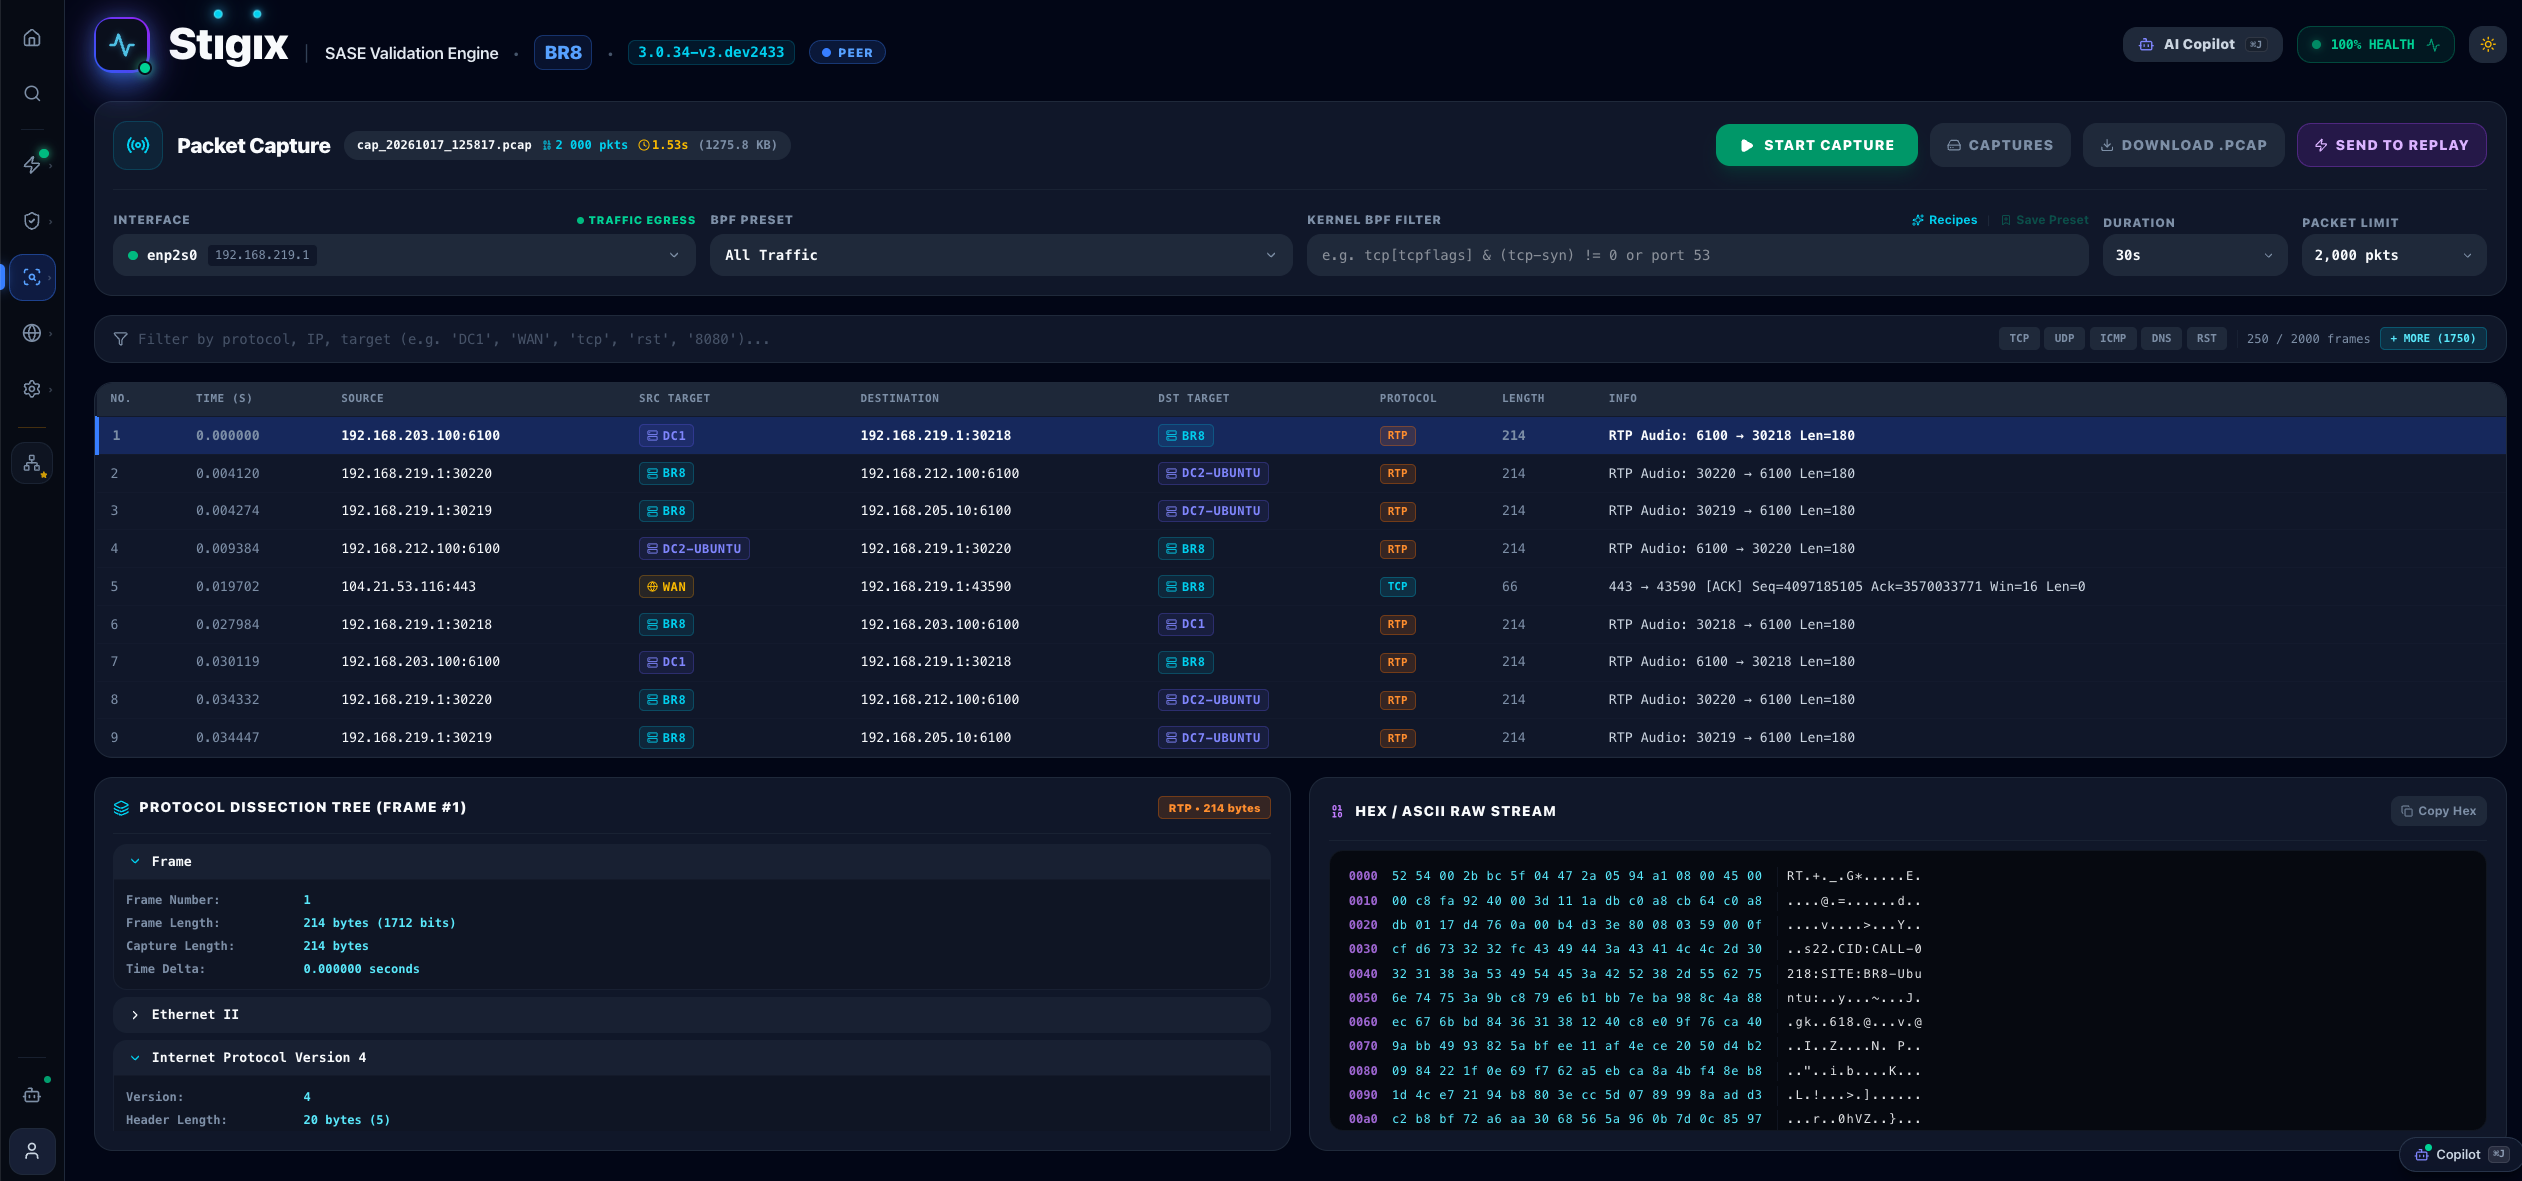
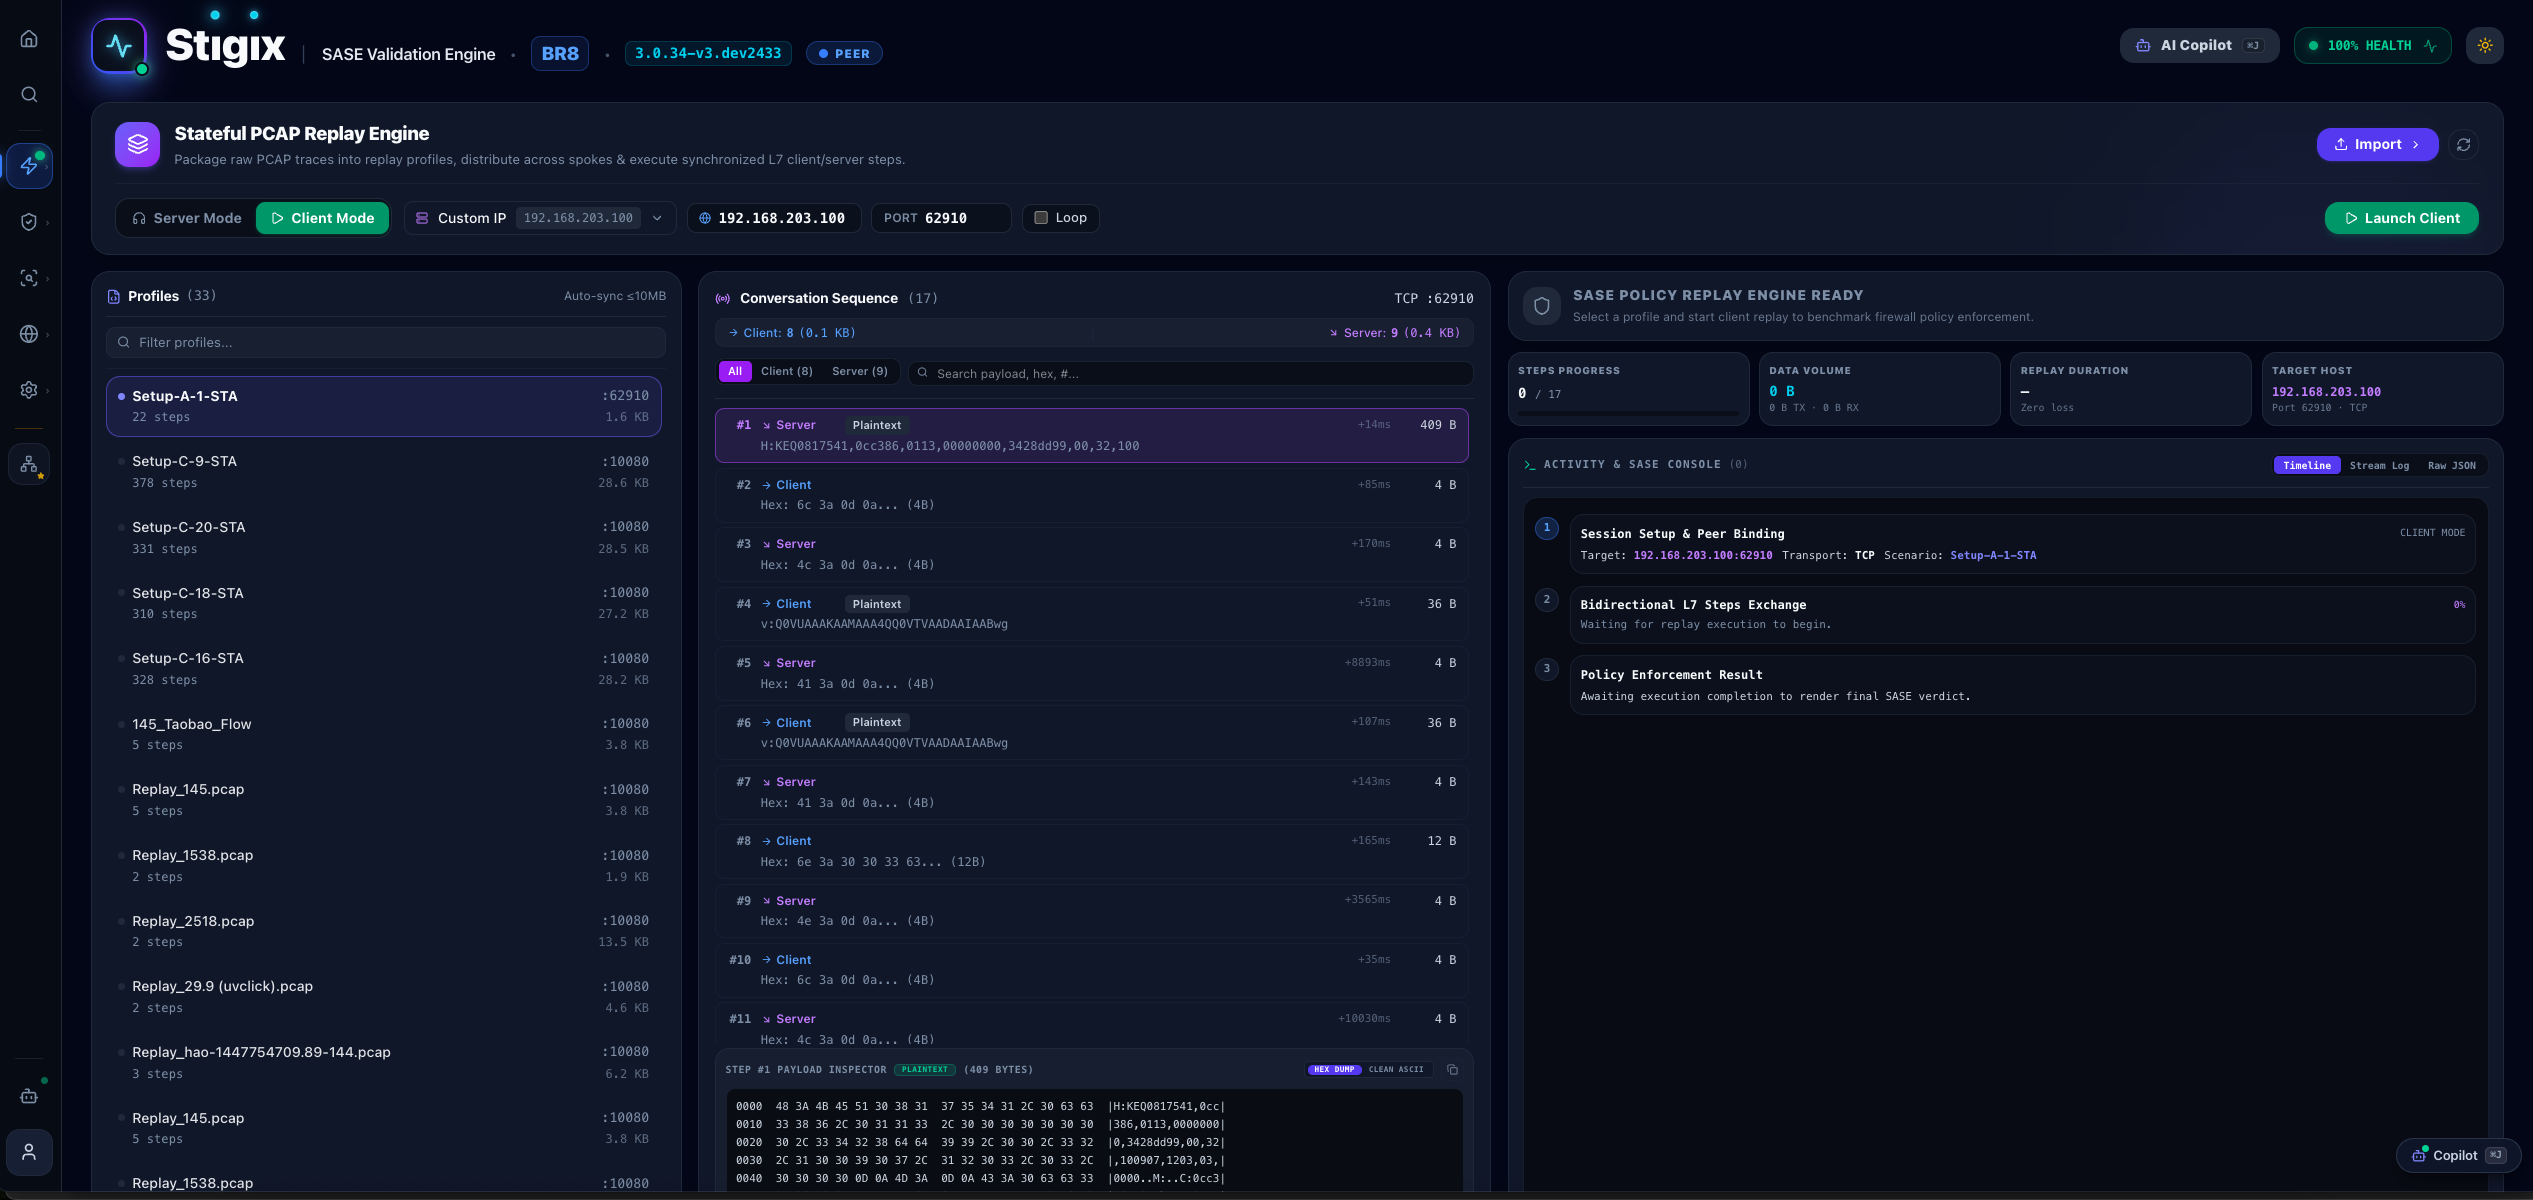
Built-in 3-pane Web Wireshark inspector (Packet List, L2–L7 Protocol Tree, synchronized Hex/ASCII dump) with 1-click BPF filter chips and .pcap export. Pair with the Stateful PCAP Replay engine to replay .pcap/.zip captures across SASE and audit enforcement verdicts (Bypass, TCP RST, Block Page).
3-Pane Wireshark BPF Filters Stateful L7 Replay SASE Verdicts
Security, C2 & AI Validation
url · dns · ips · aisa beta
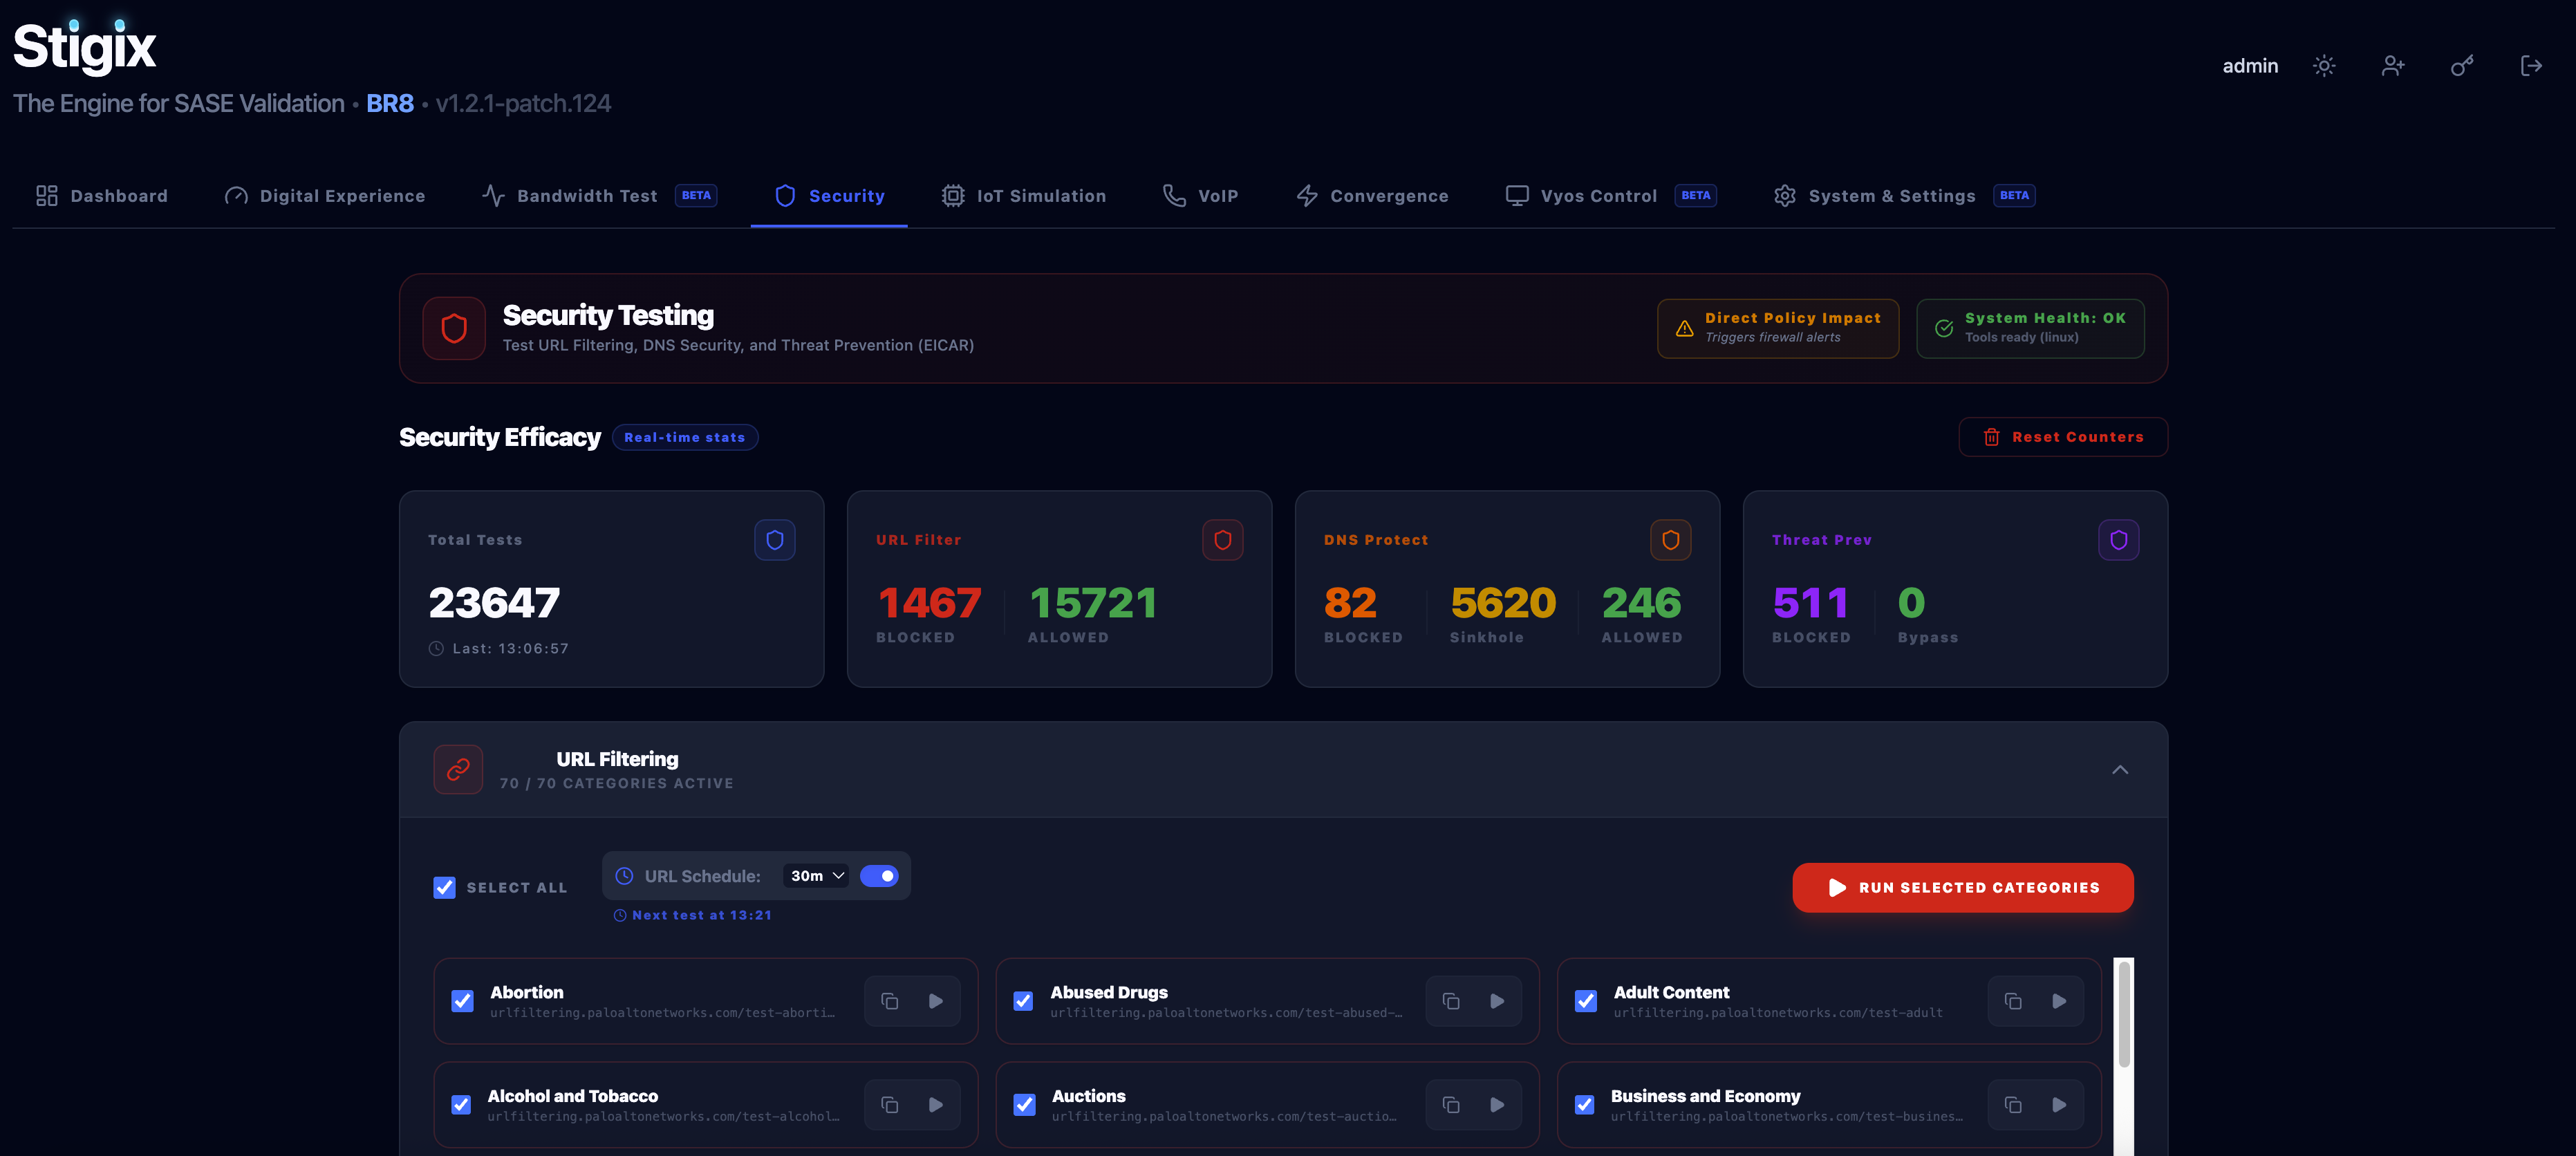
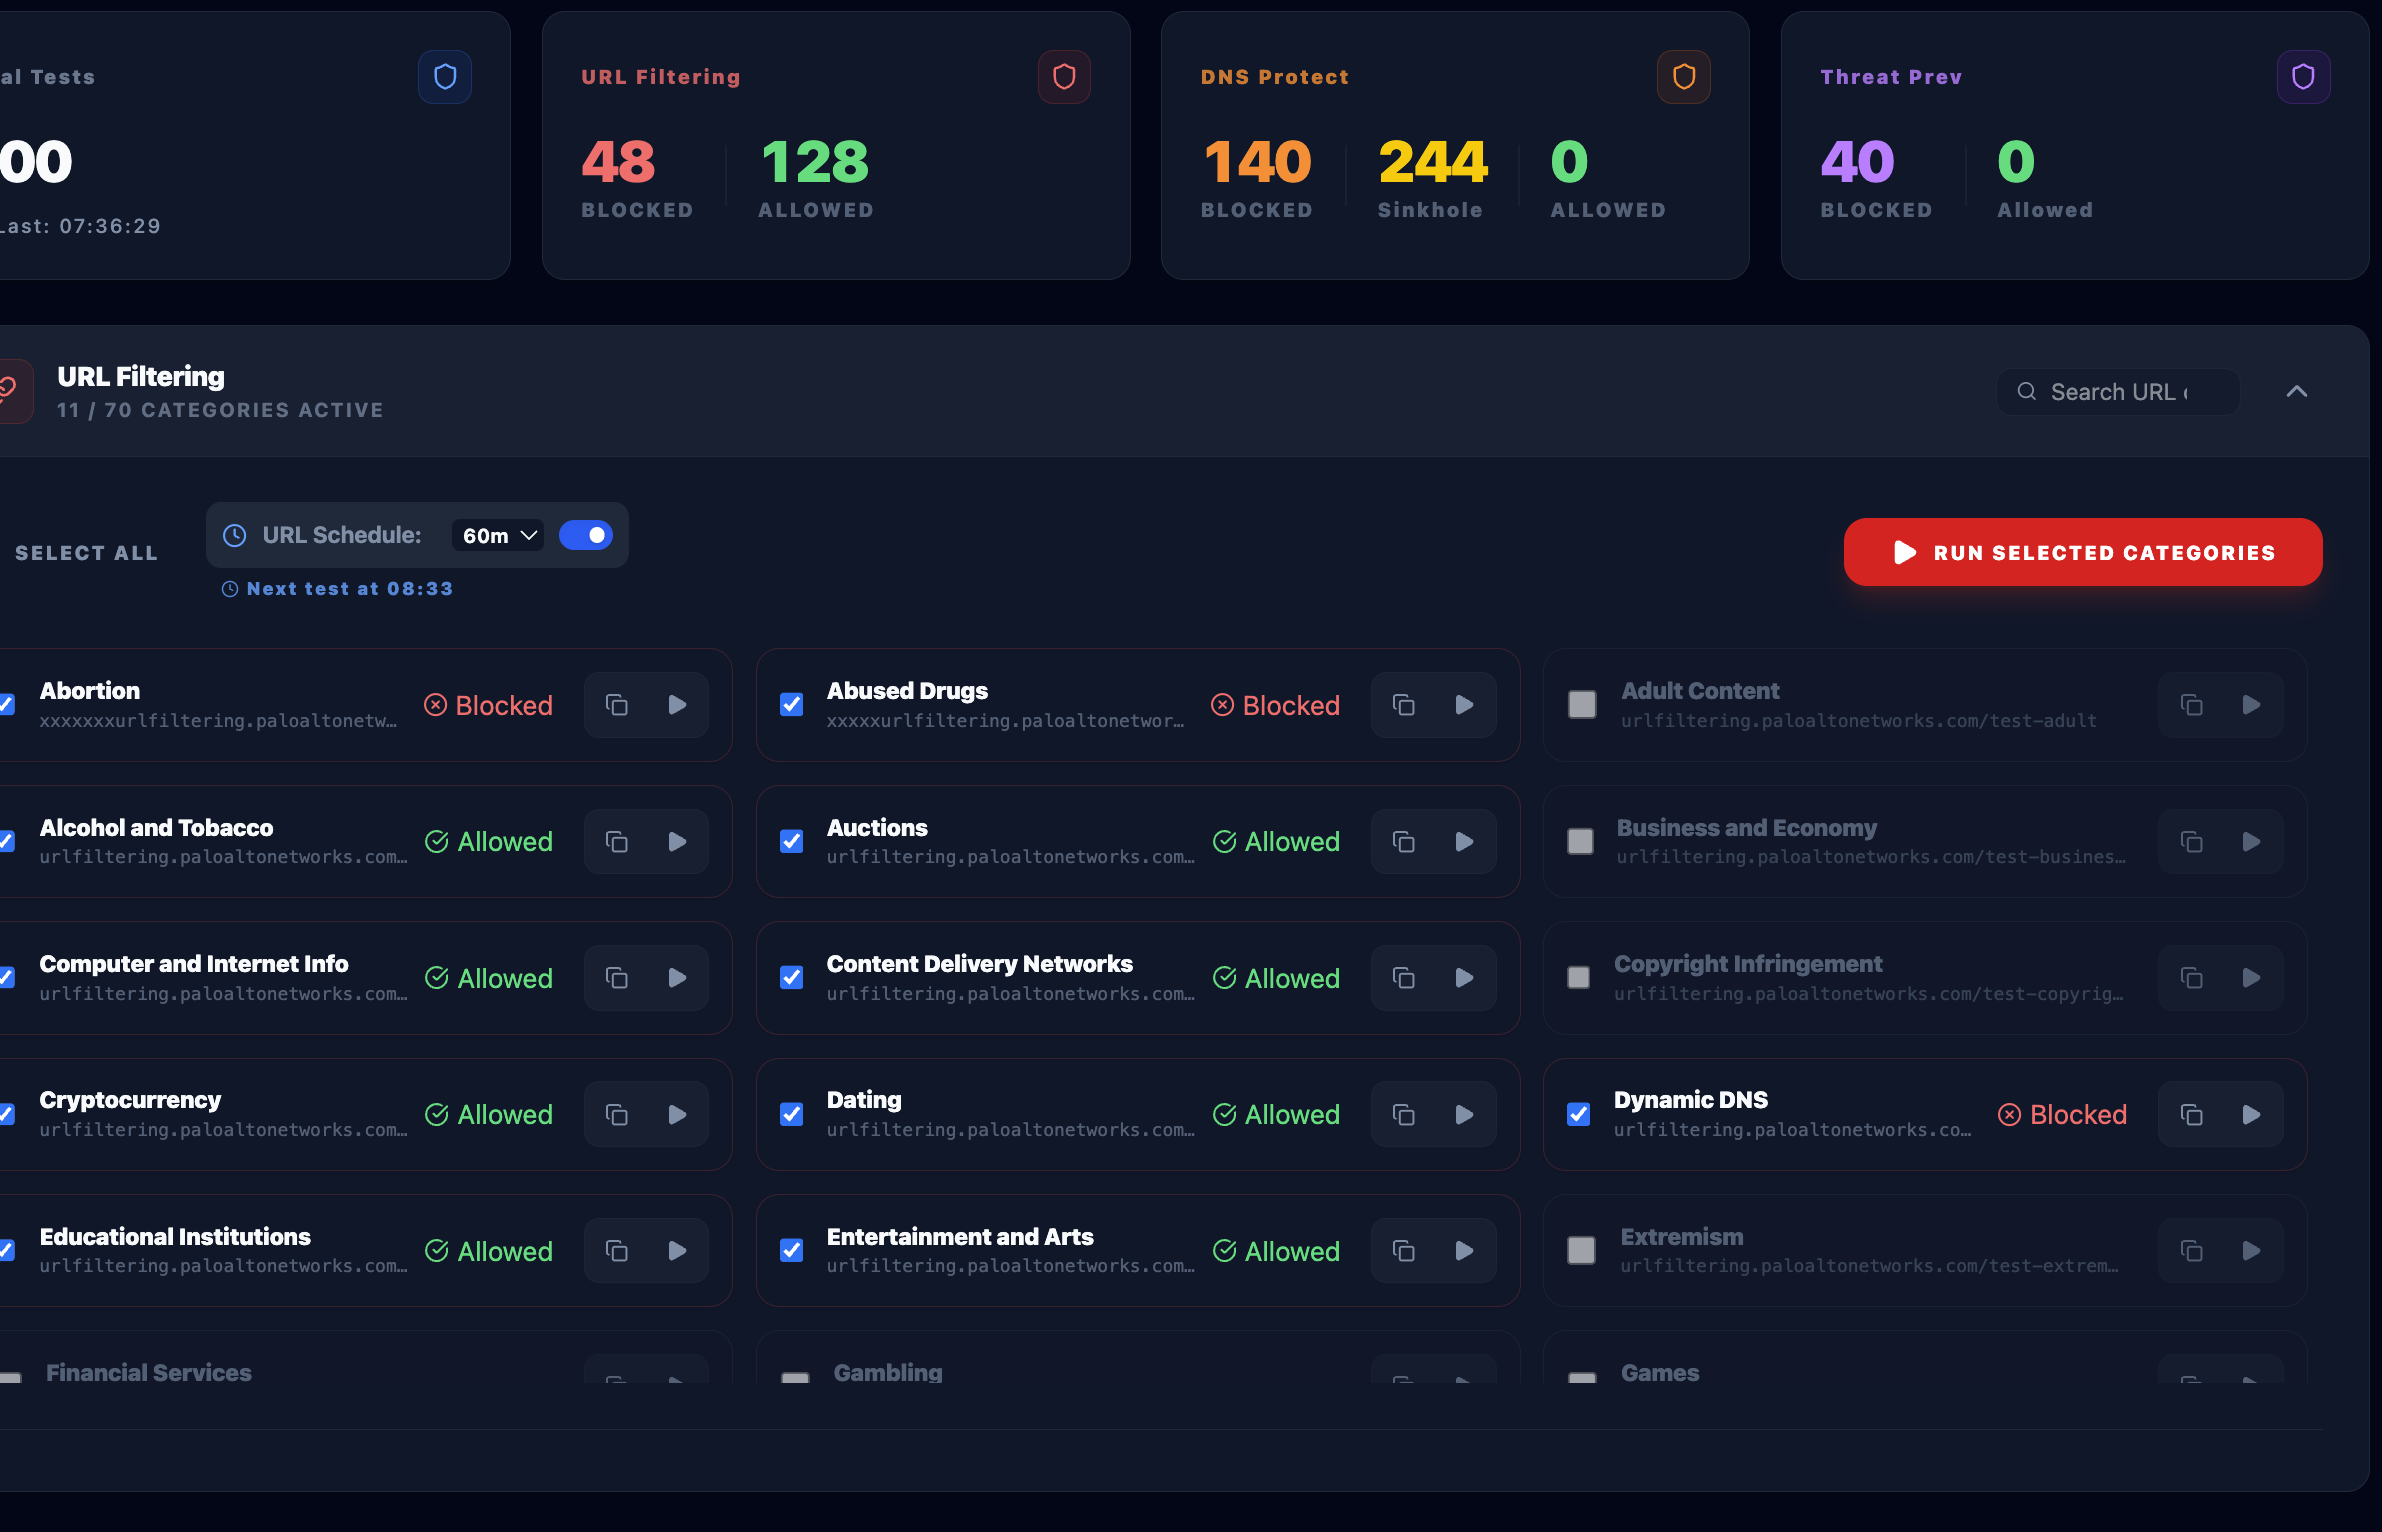
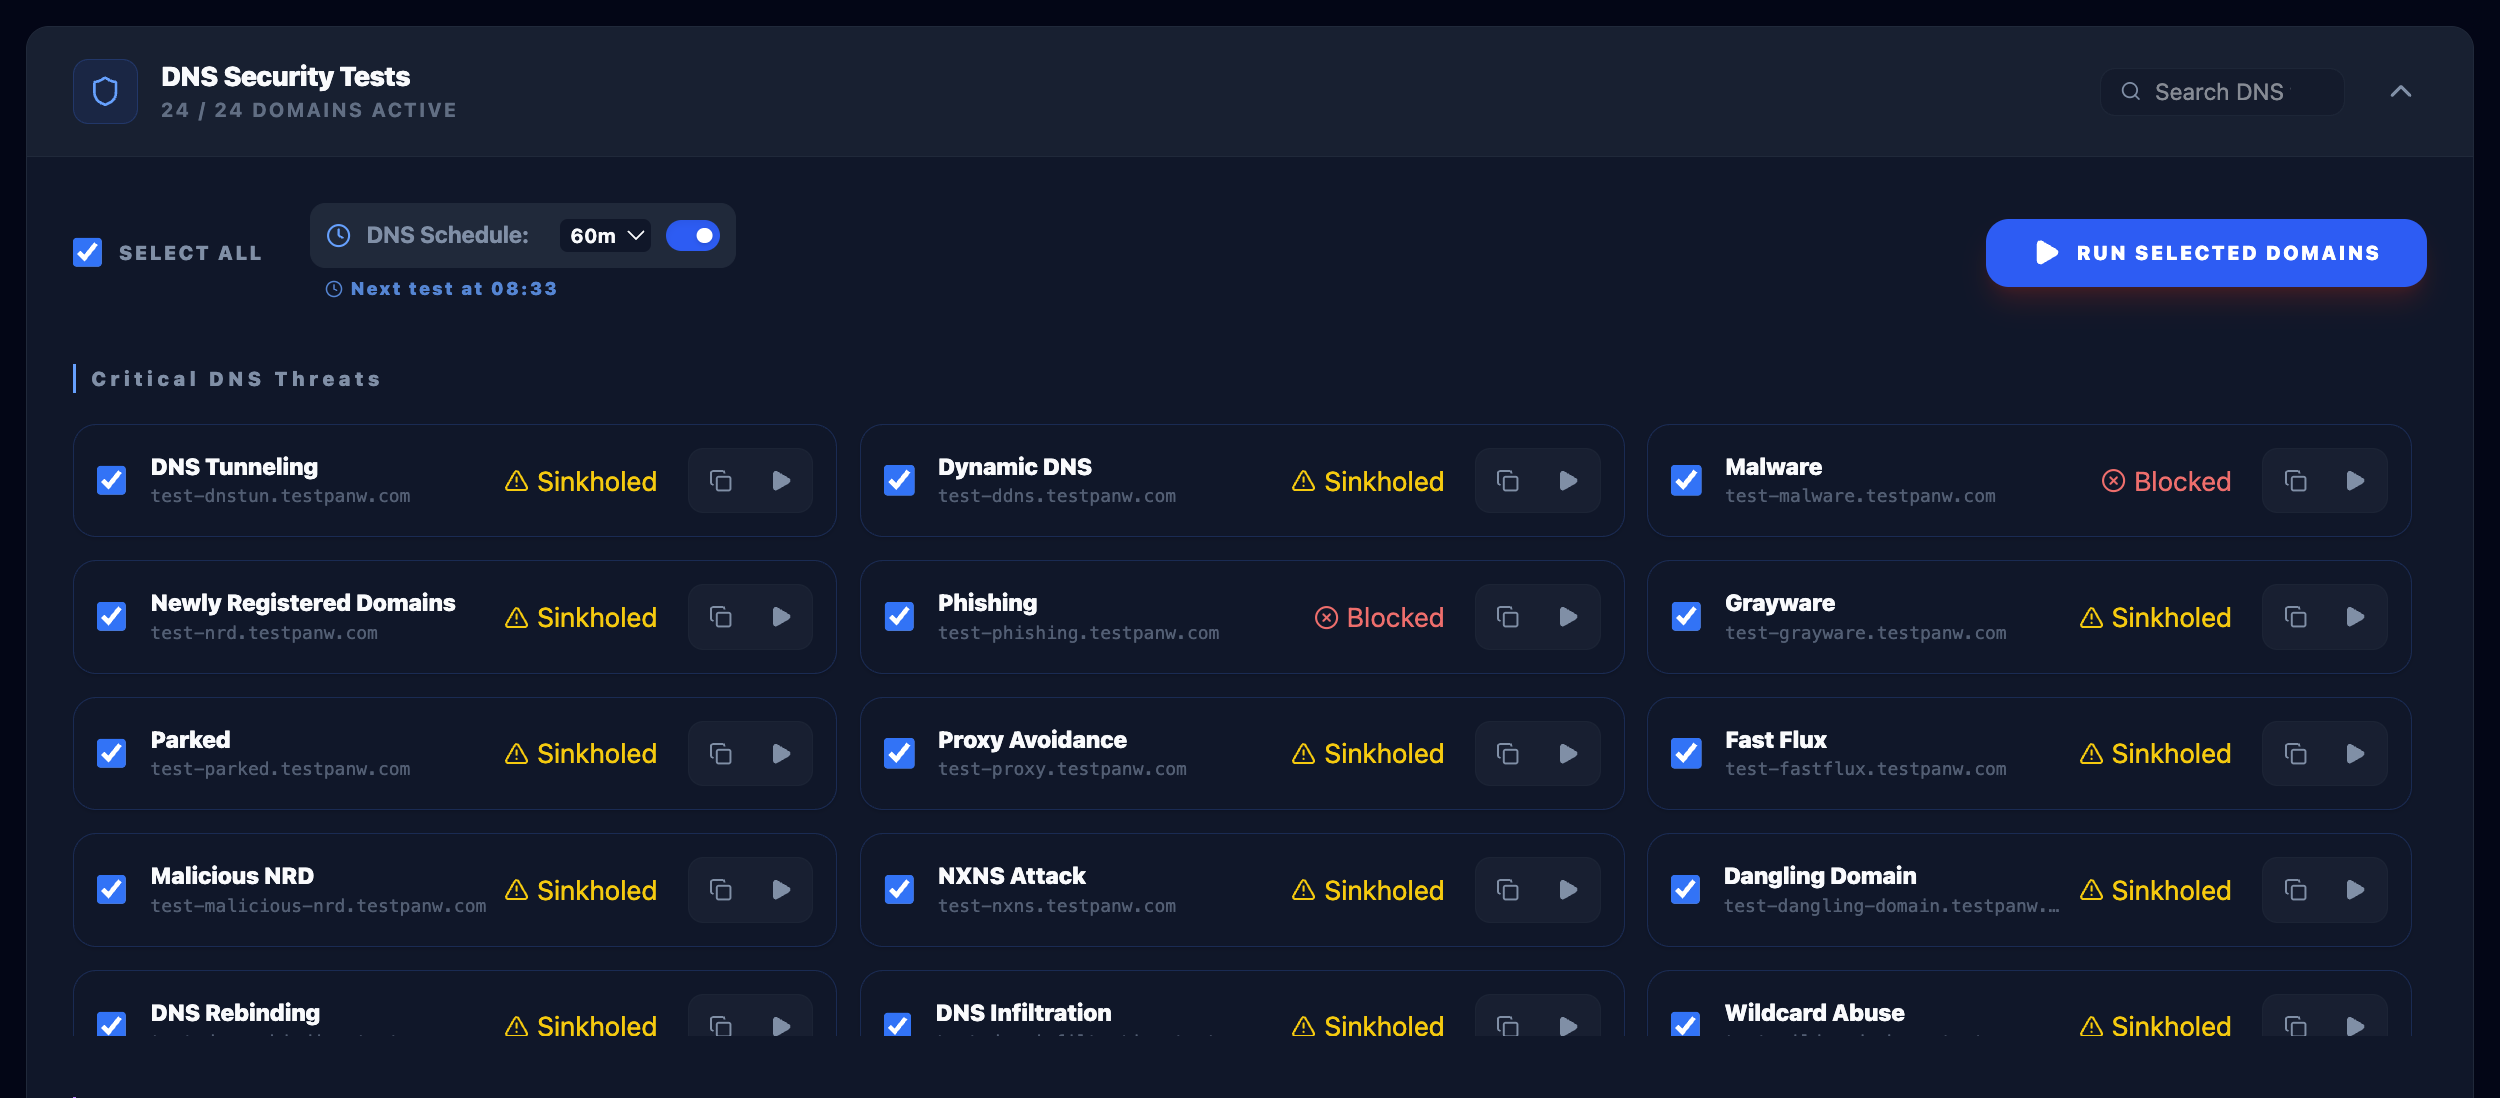
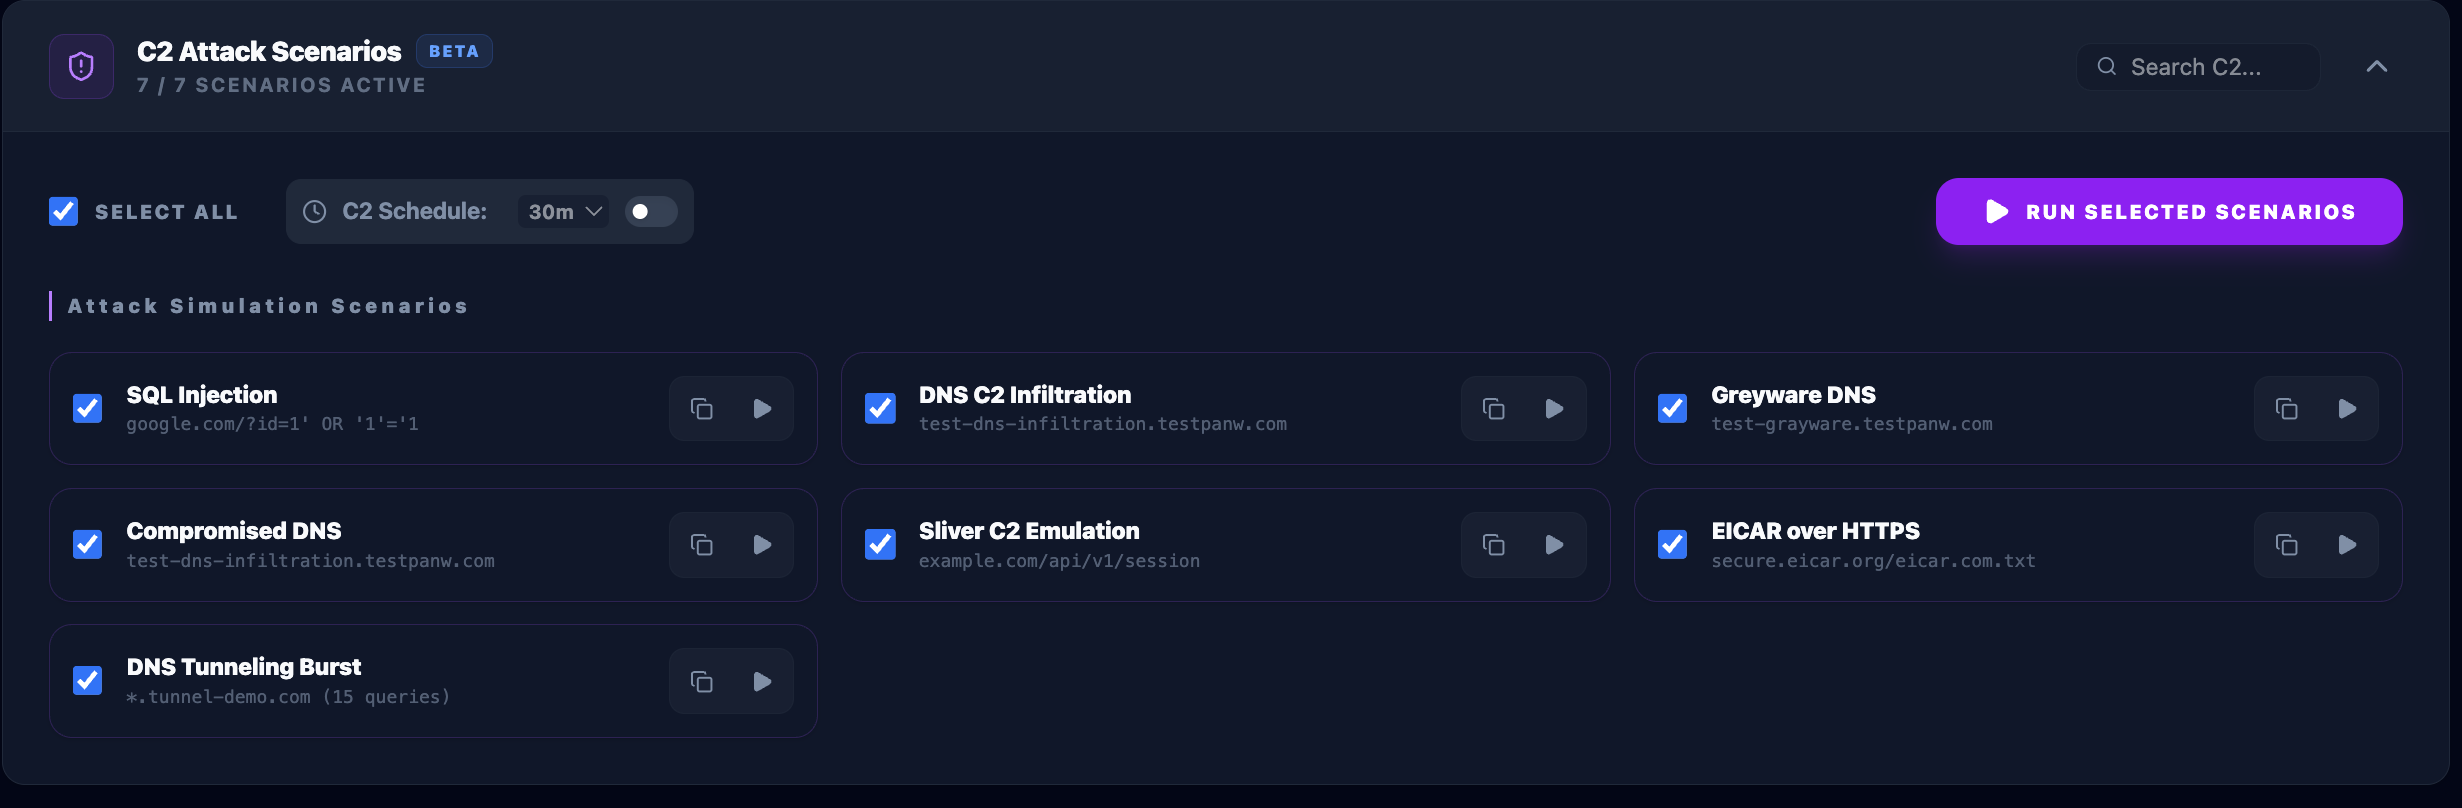
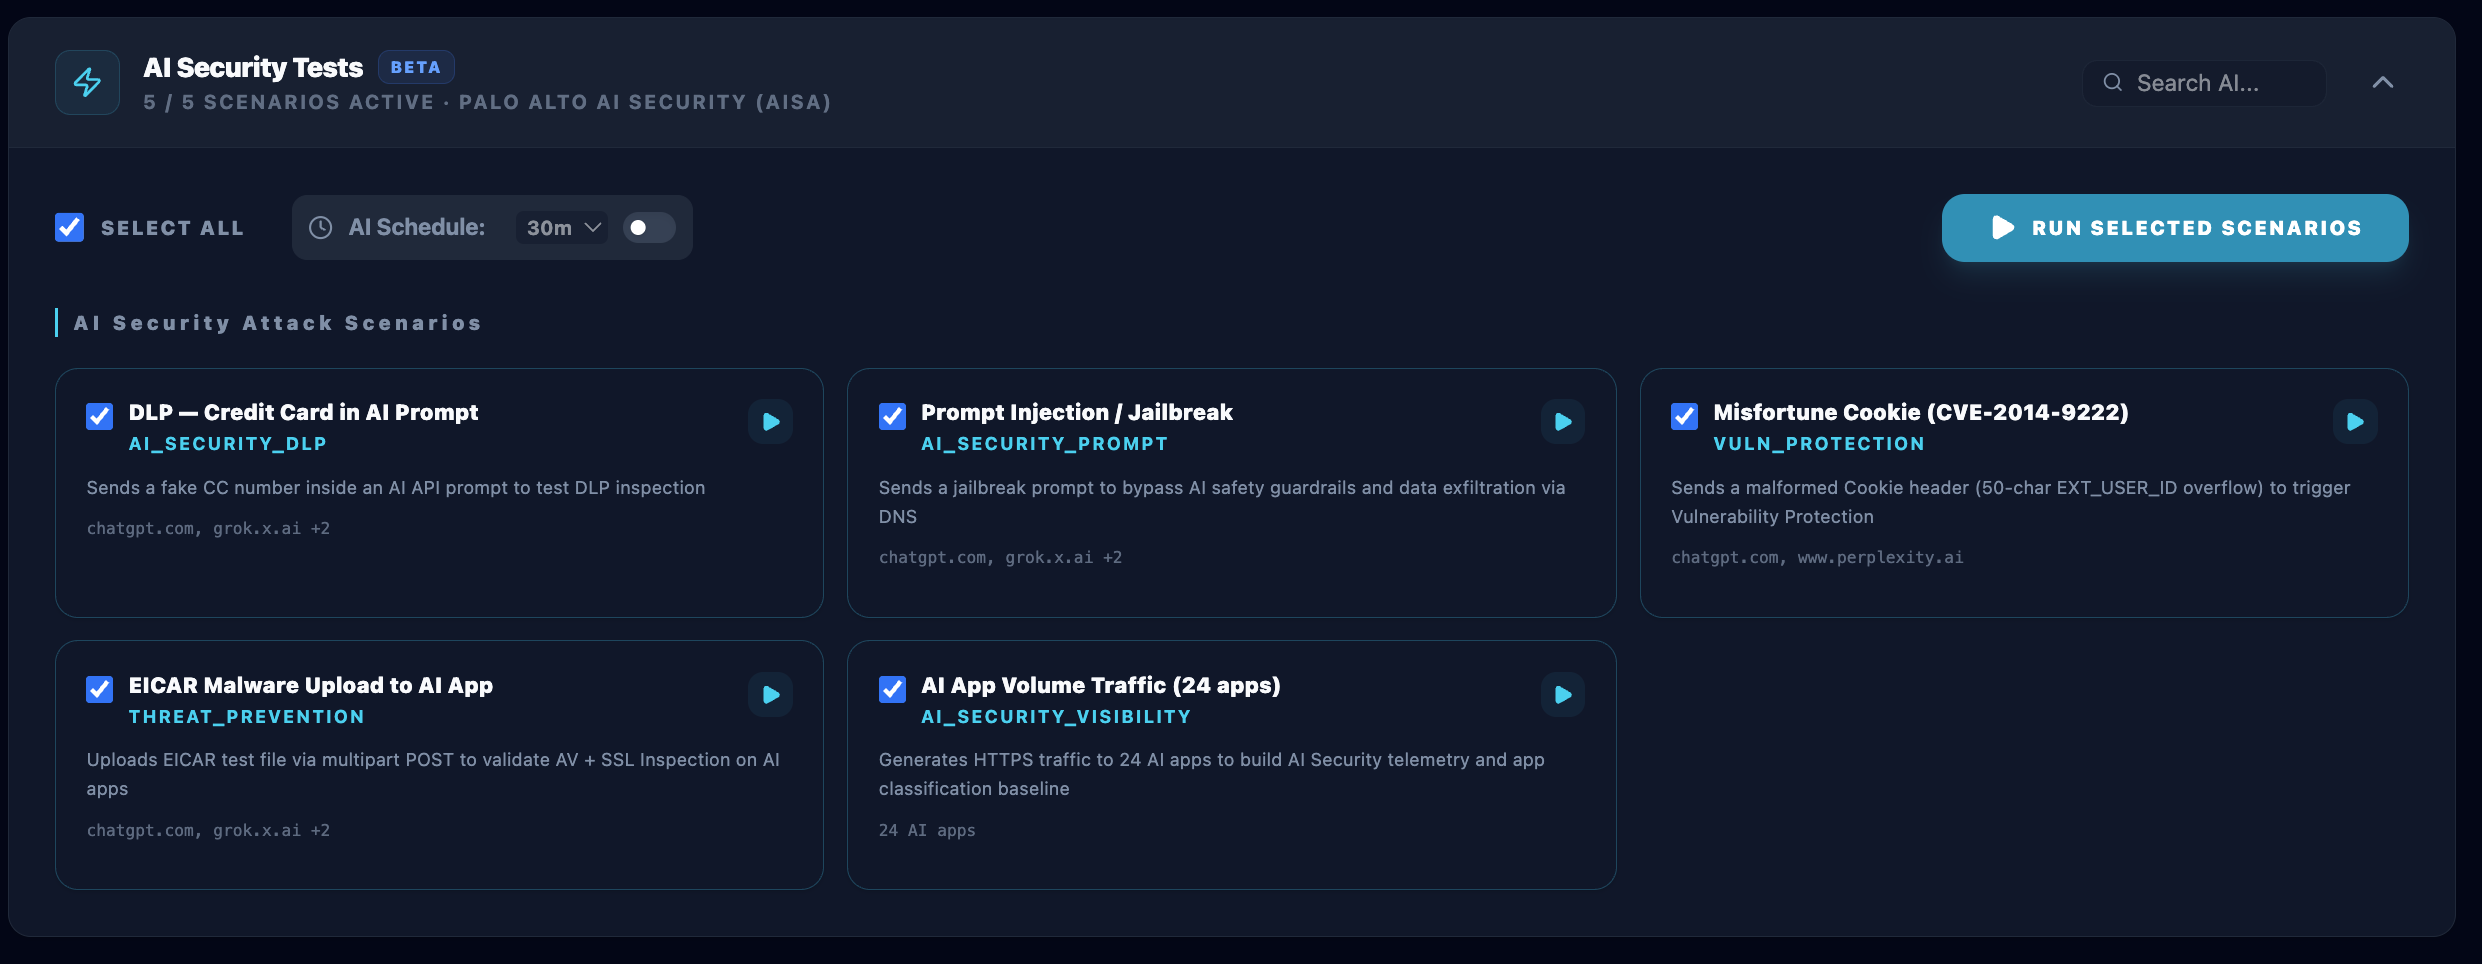
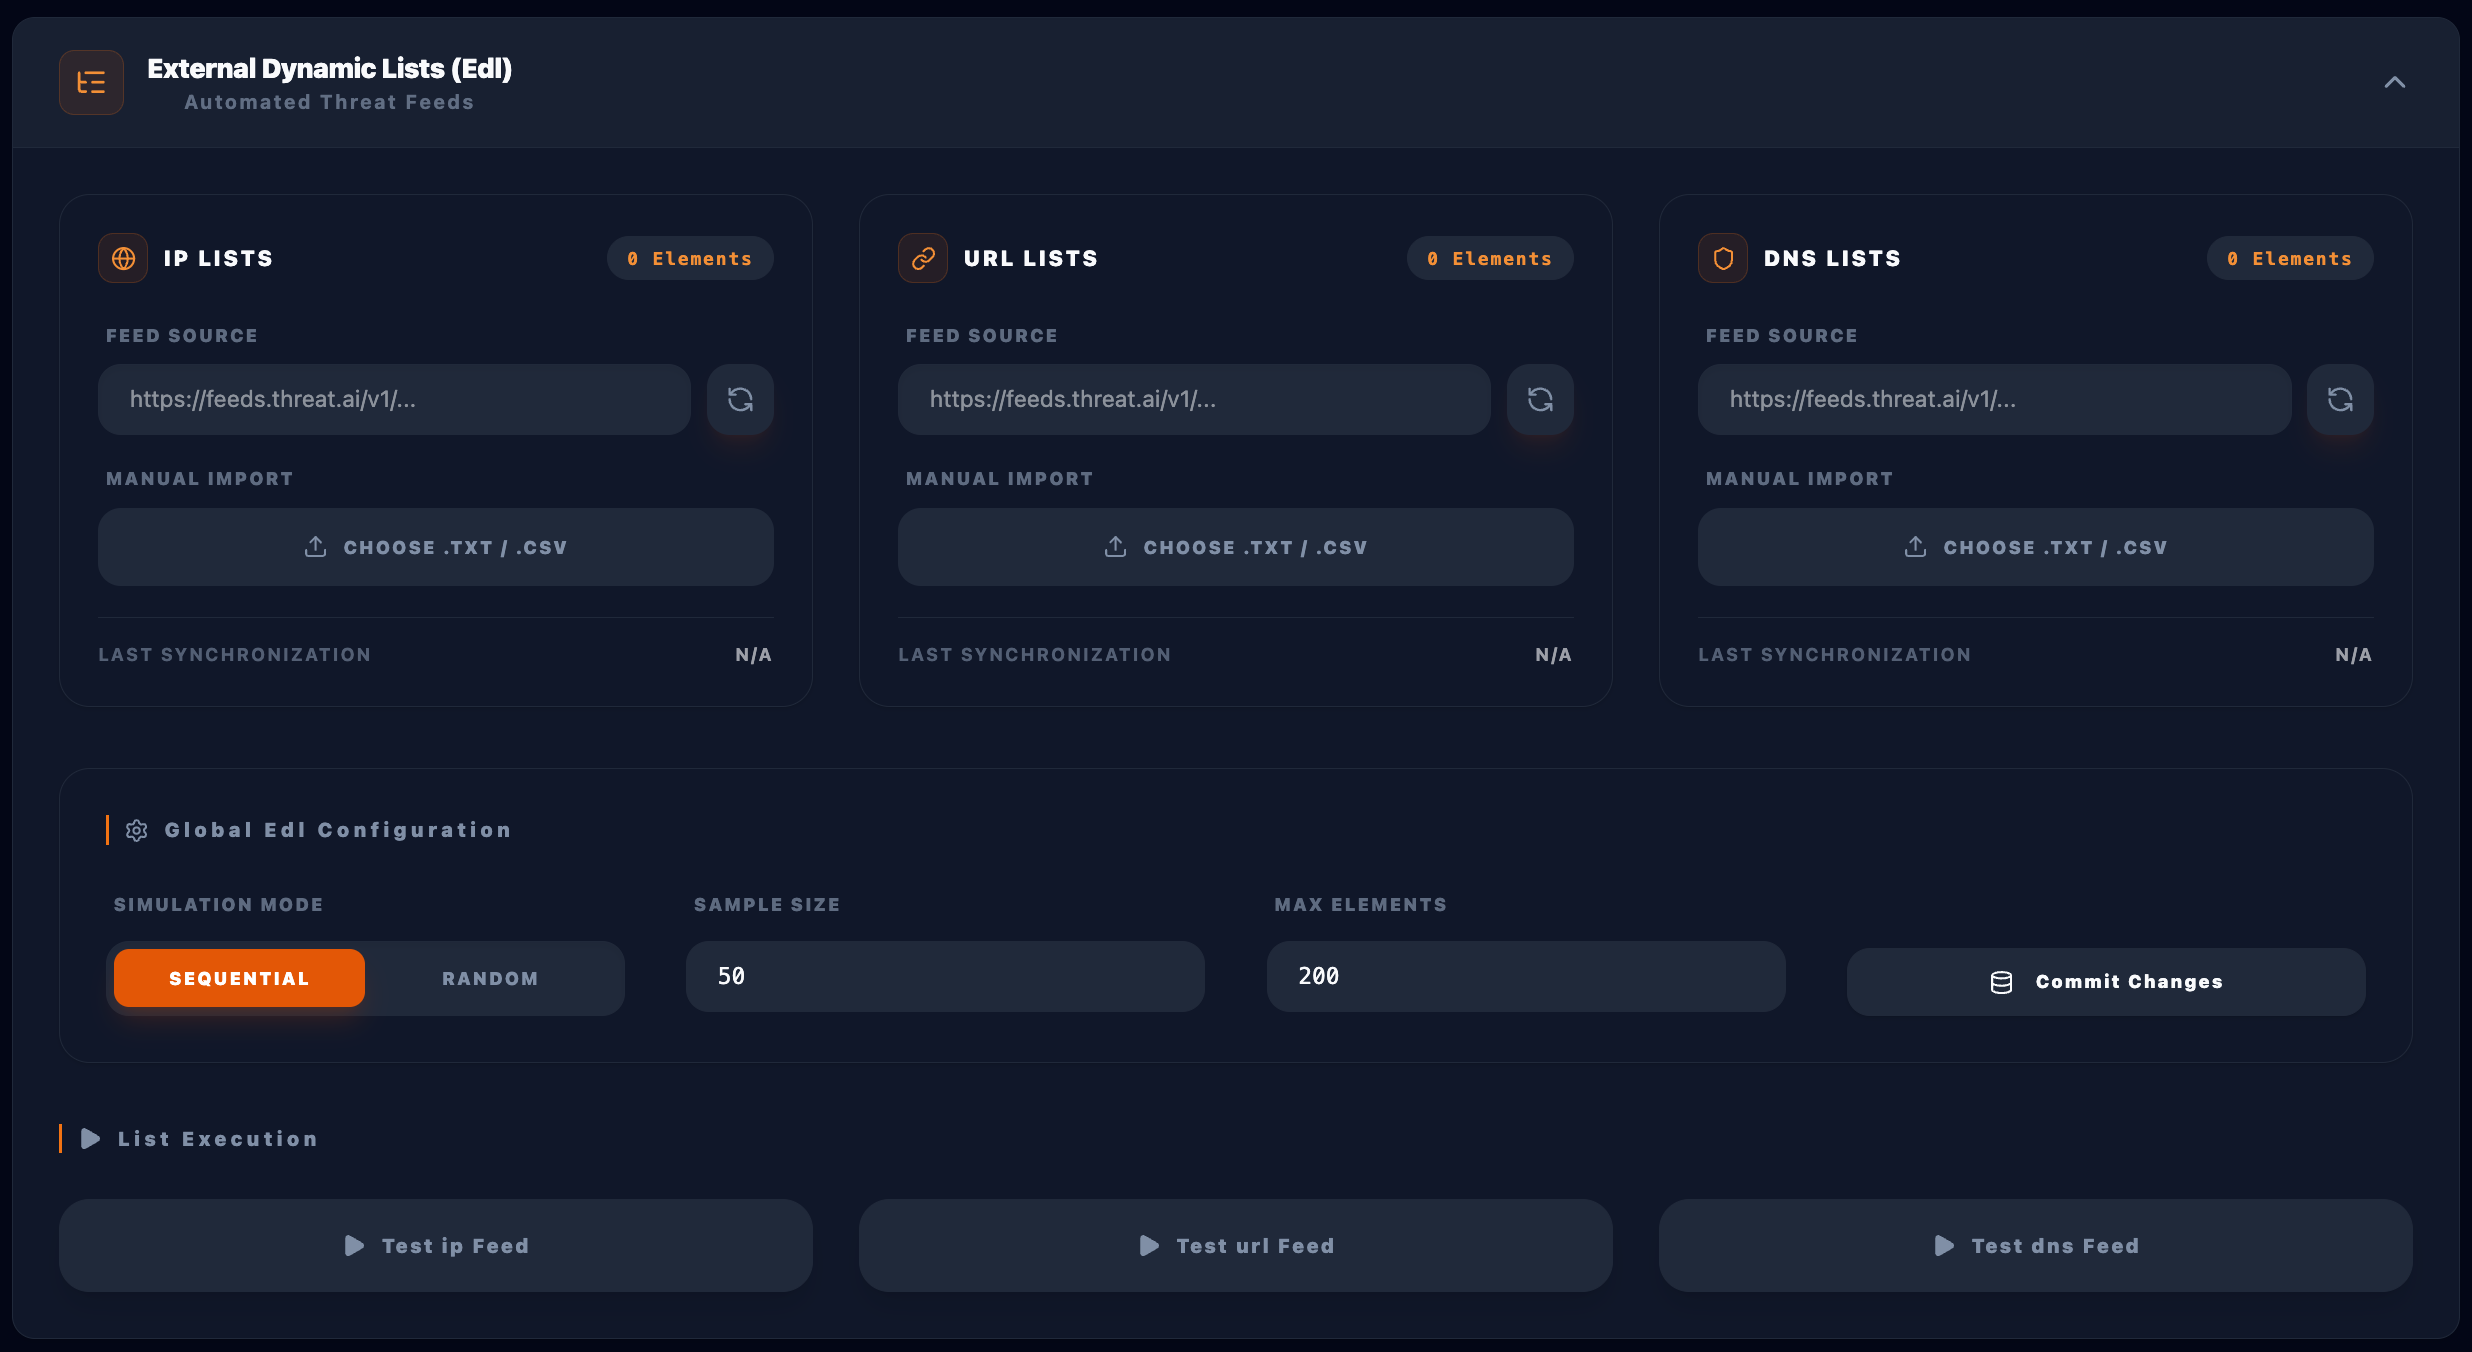
Audits 70 URL categories, 24 malicious DNS patterns (DGA/tunneling), EICAR threat prevention, EDL feeds, and 7 real-traffic C2 attack scenarios (SQLi, Sliver C2, DNS C2). Includes AI Security (BETA) scenarios testing DLP exfiltration and prompt injection against live AI platforms.
70 URL Cats DNS & EICAR 7 C2 Attacks AI DLP (Beta)
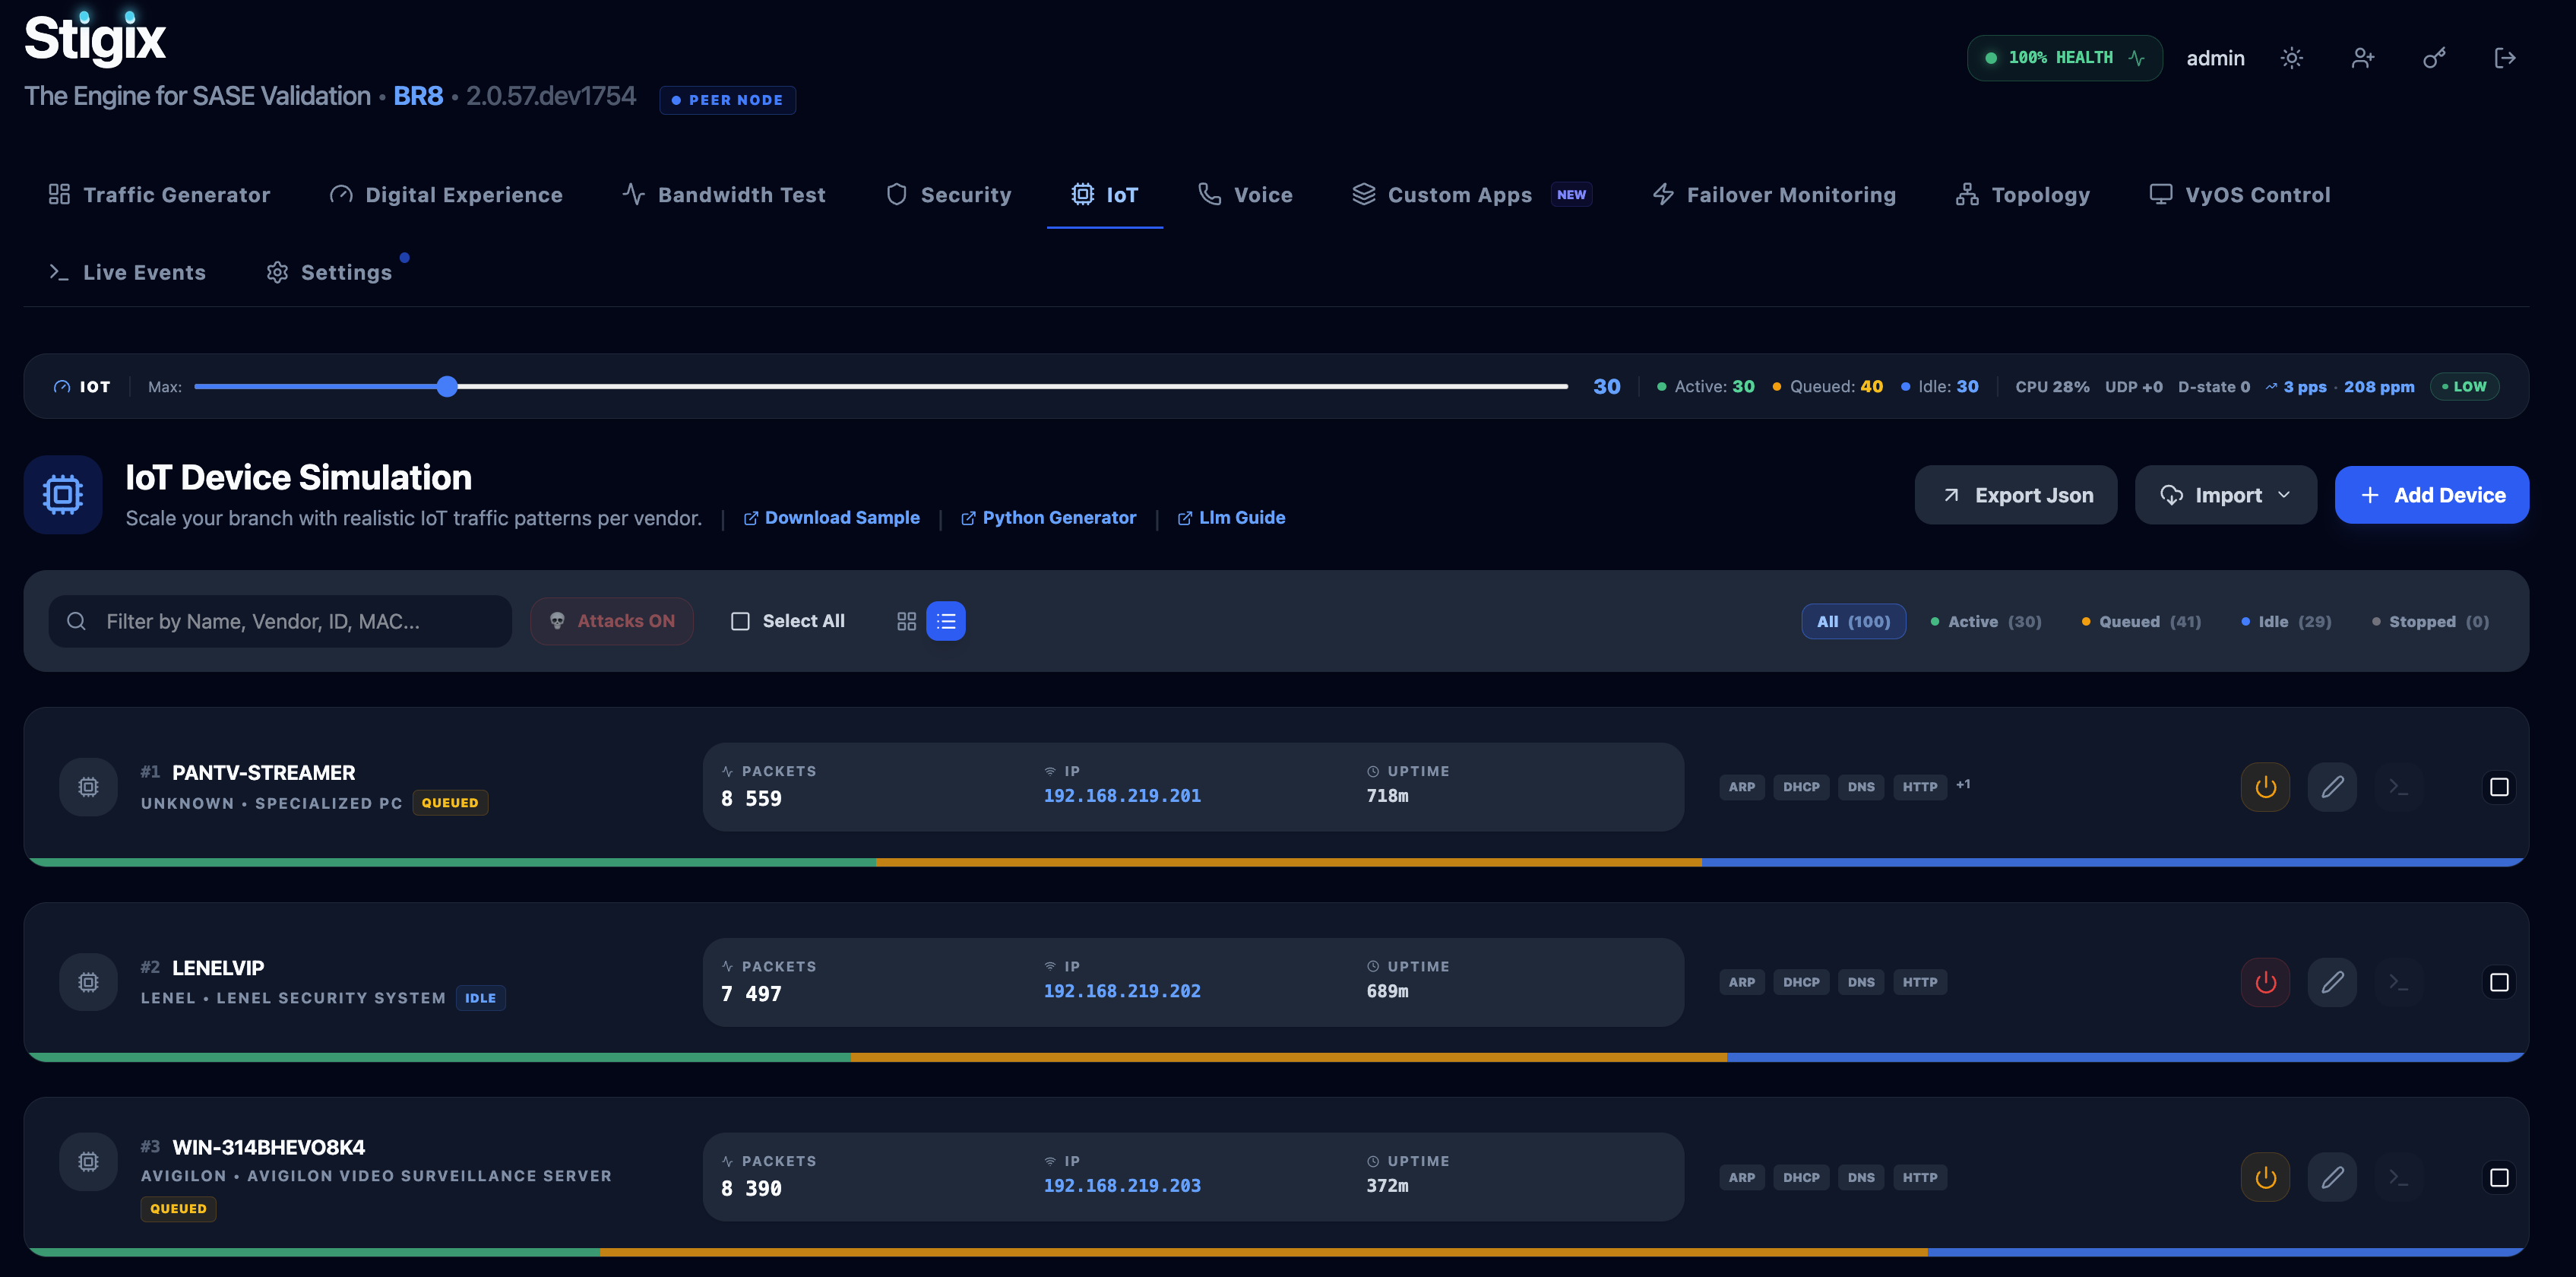
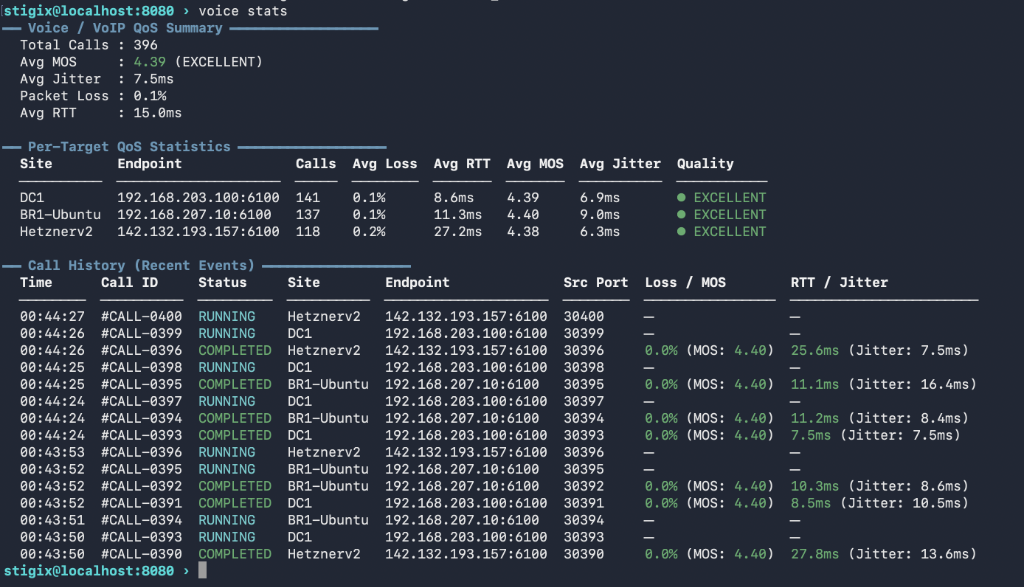
Voice (VoIP) & IoT Simulation
rtp mos · layer-2/3 scapy
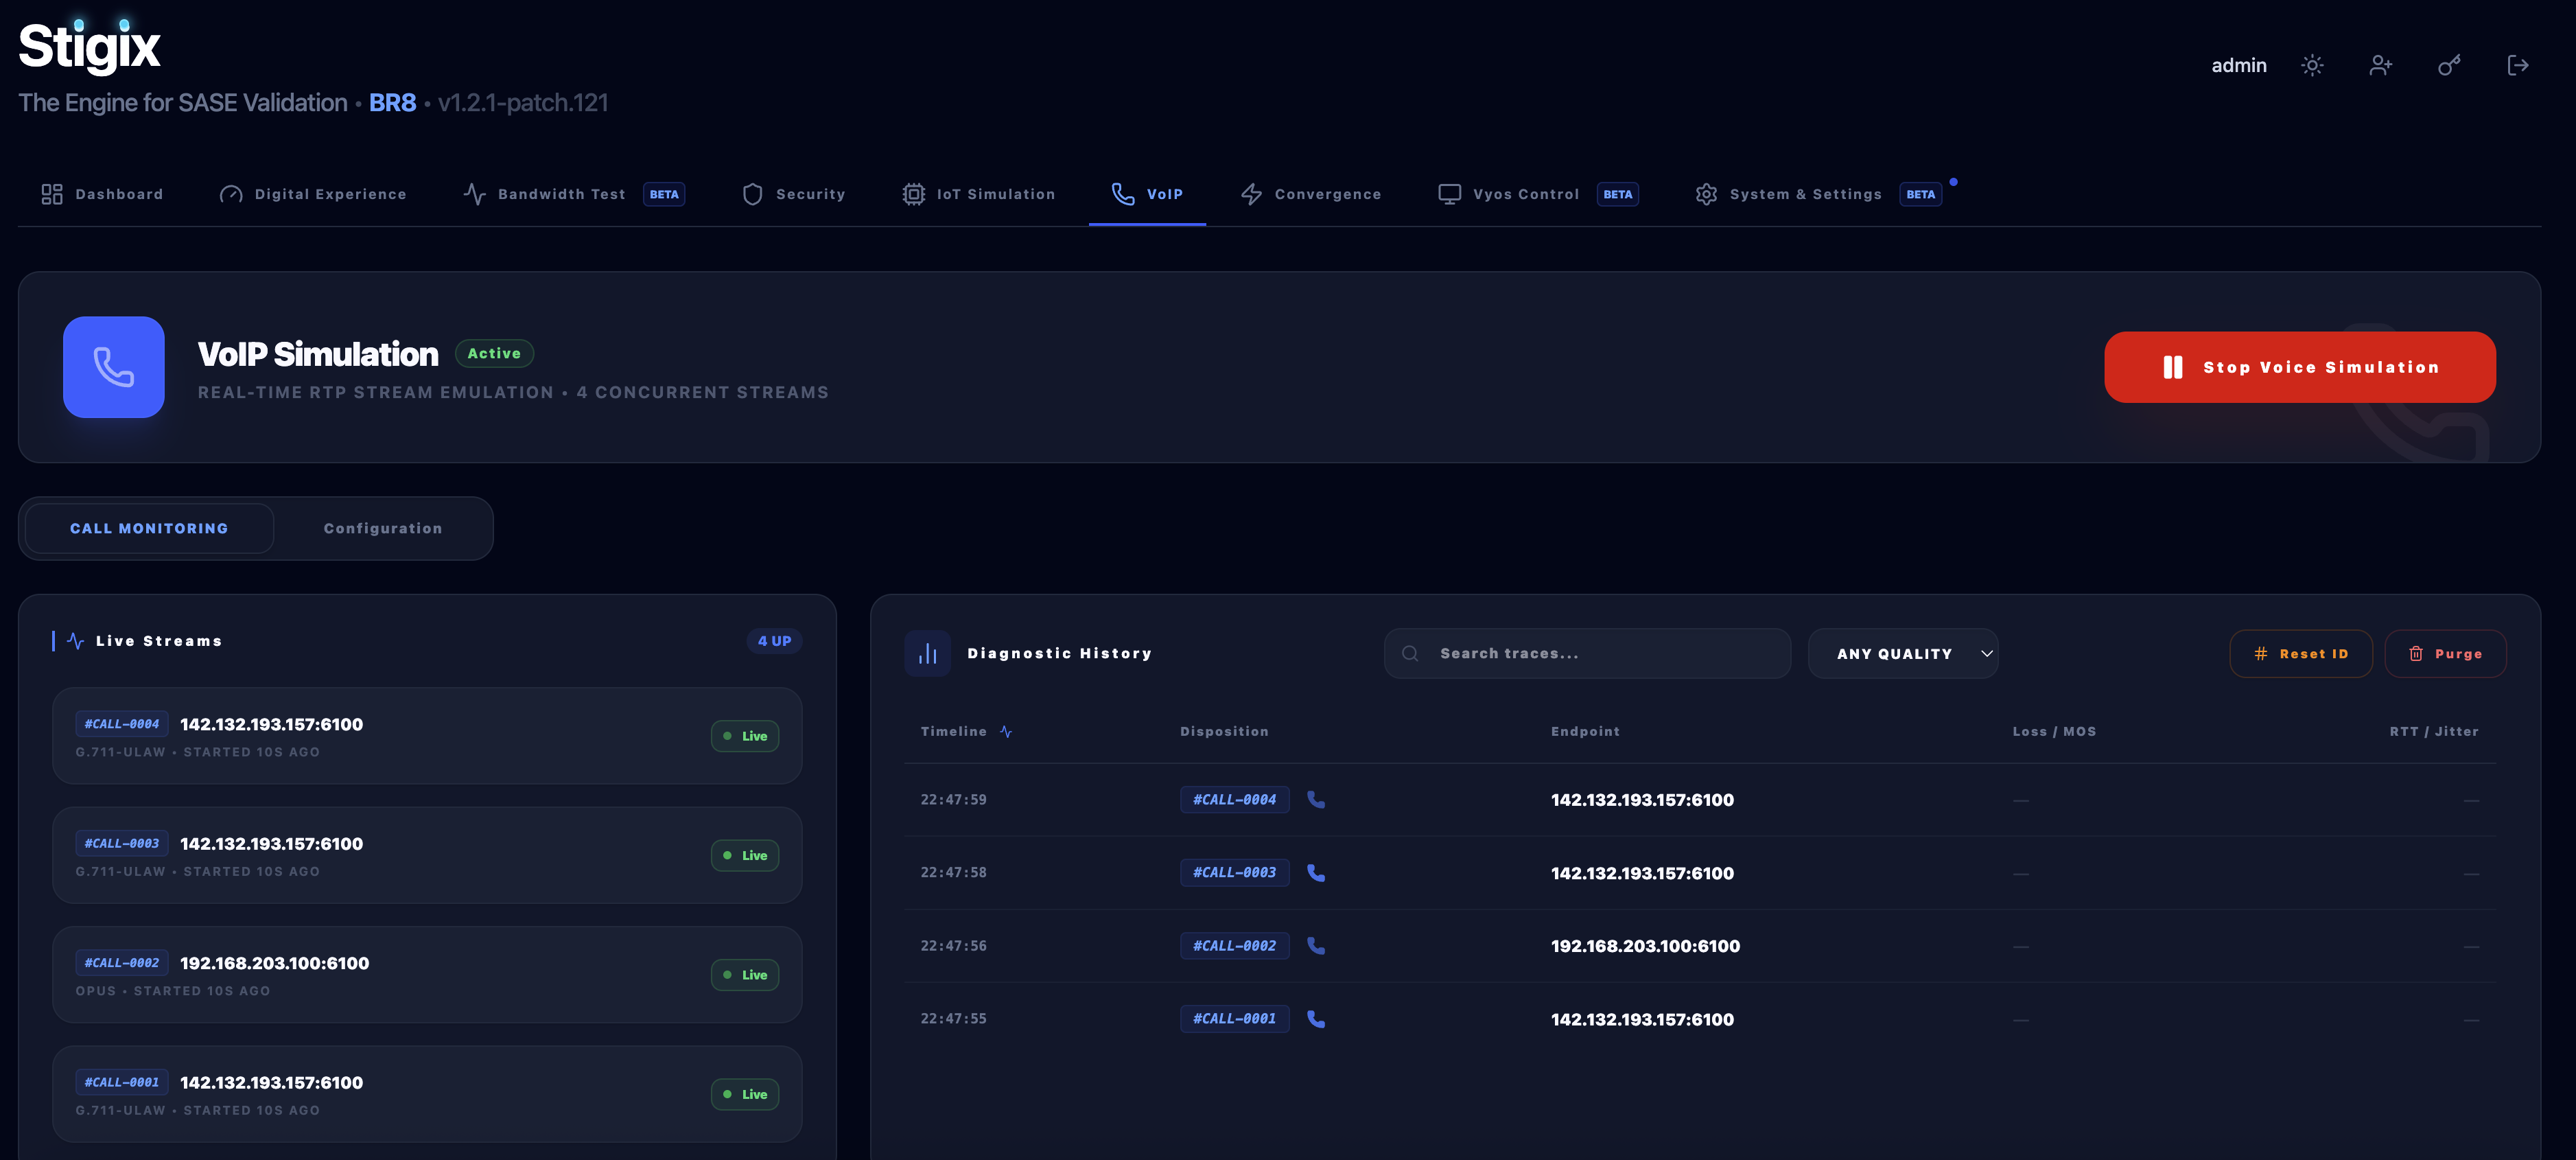
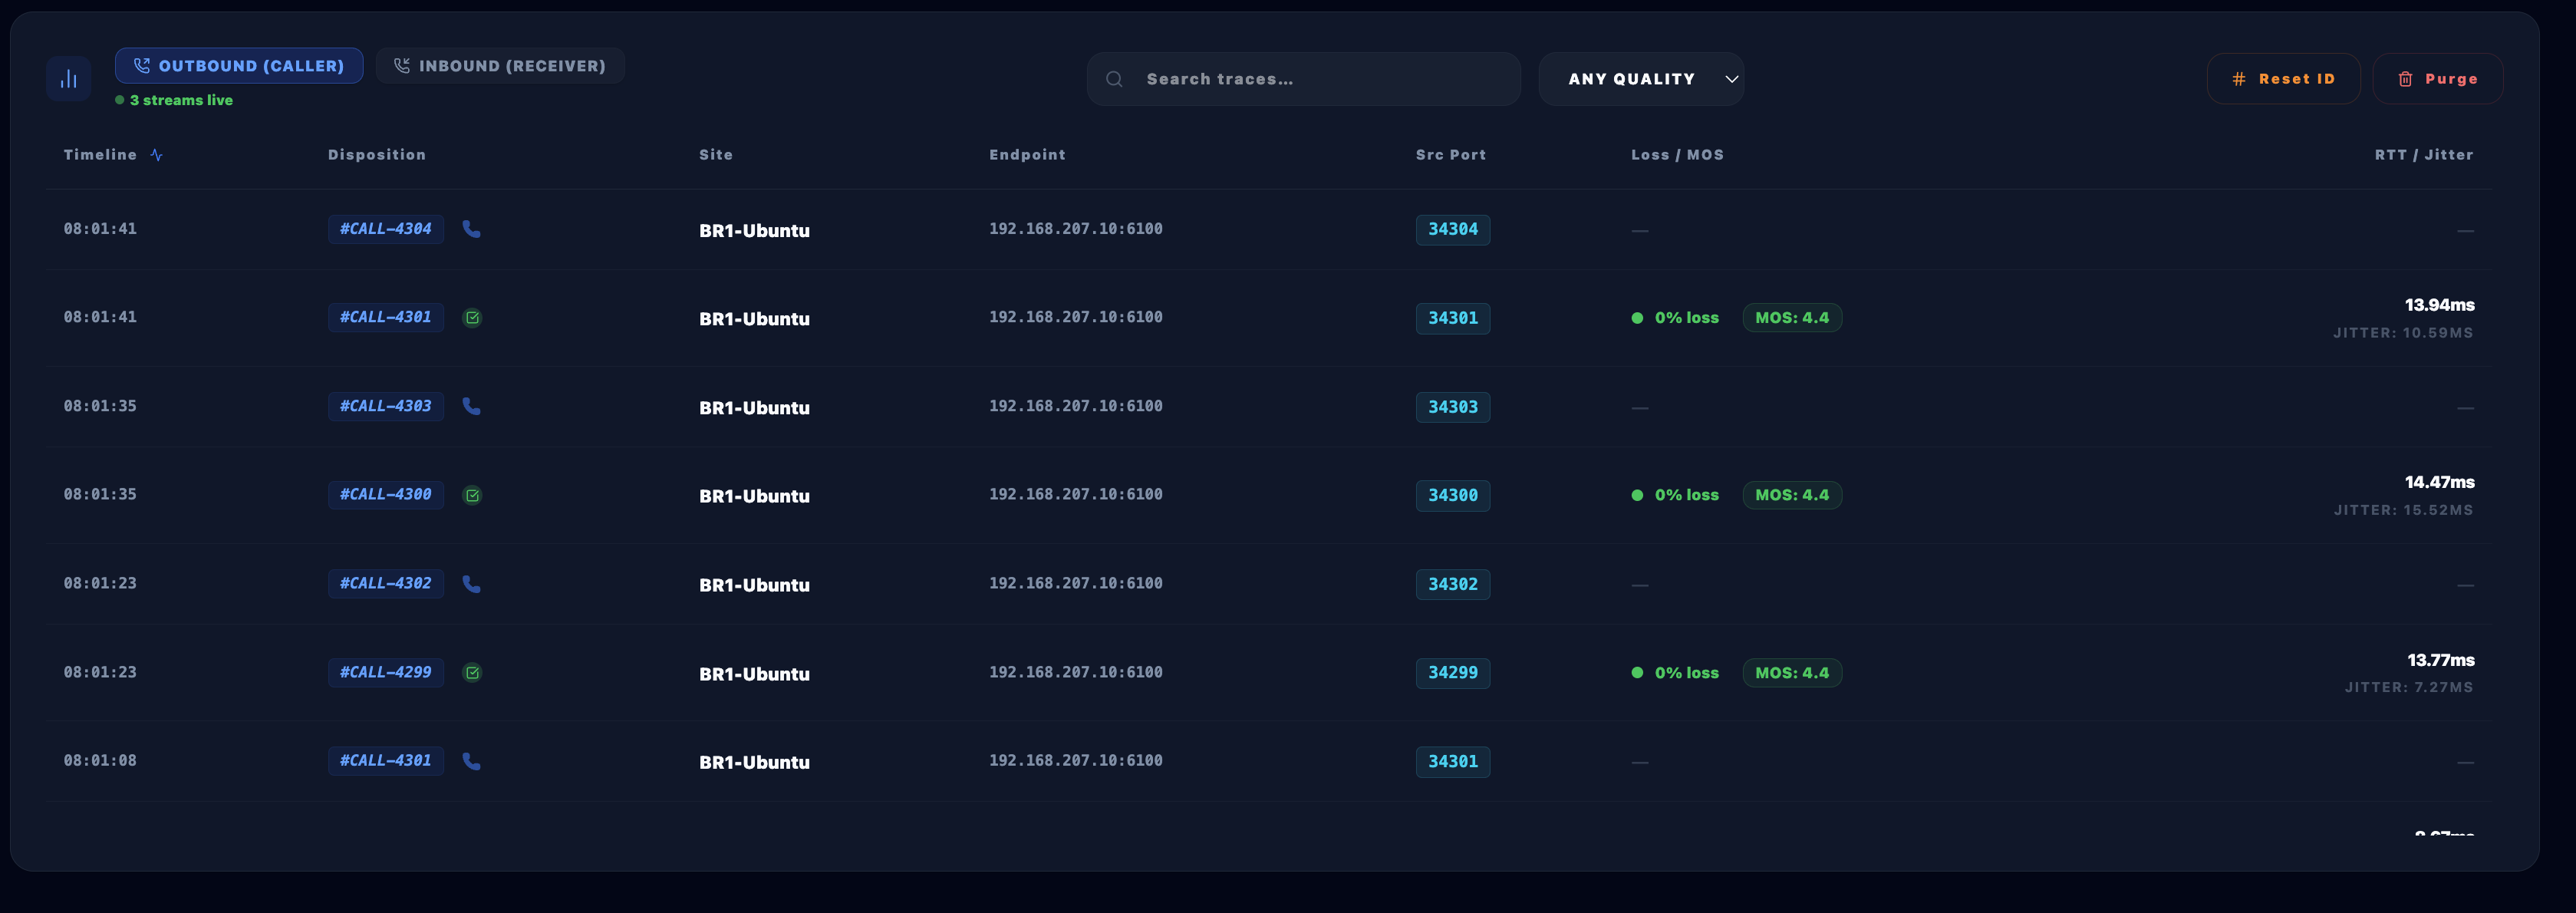
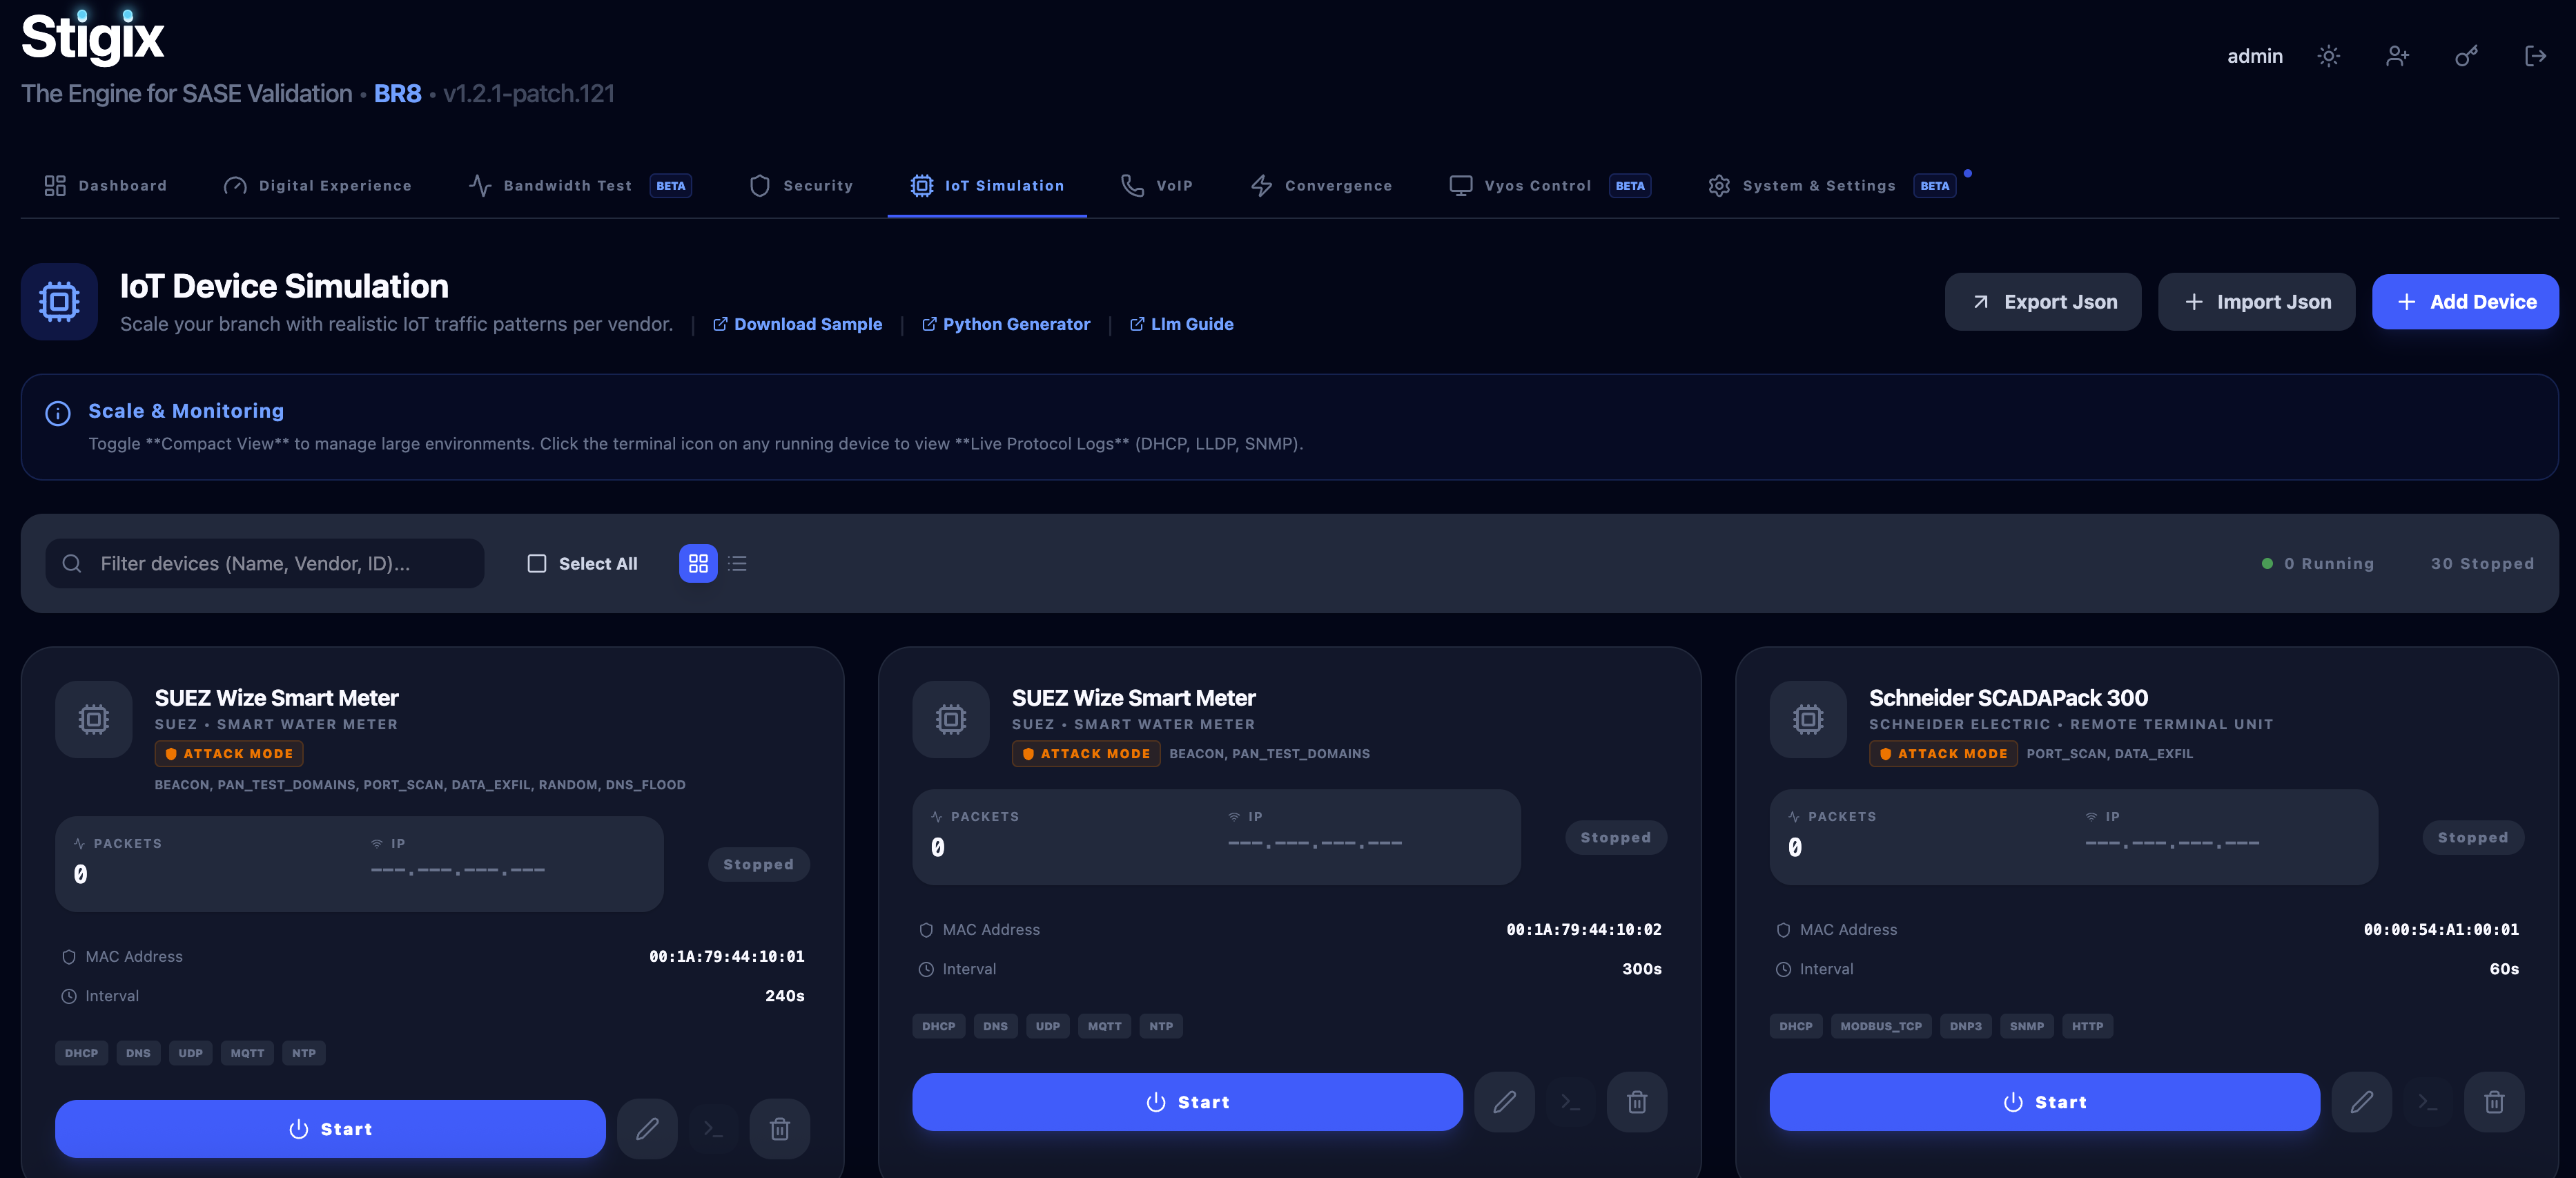
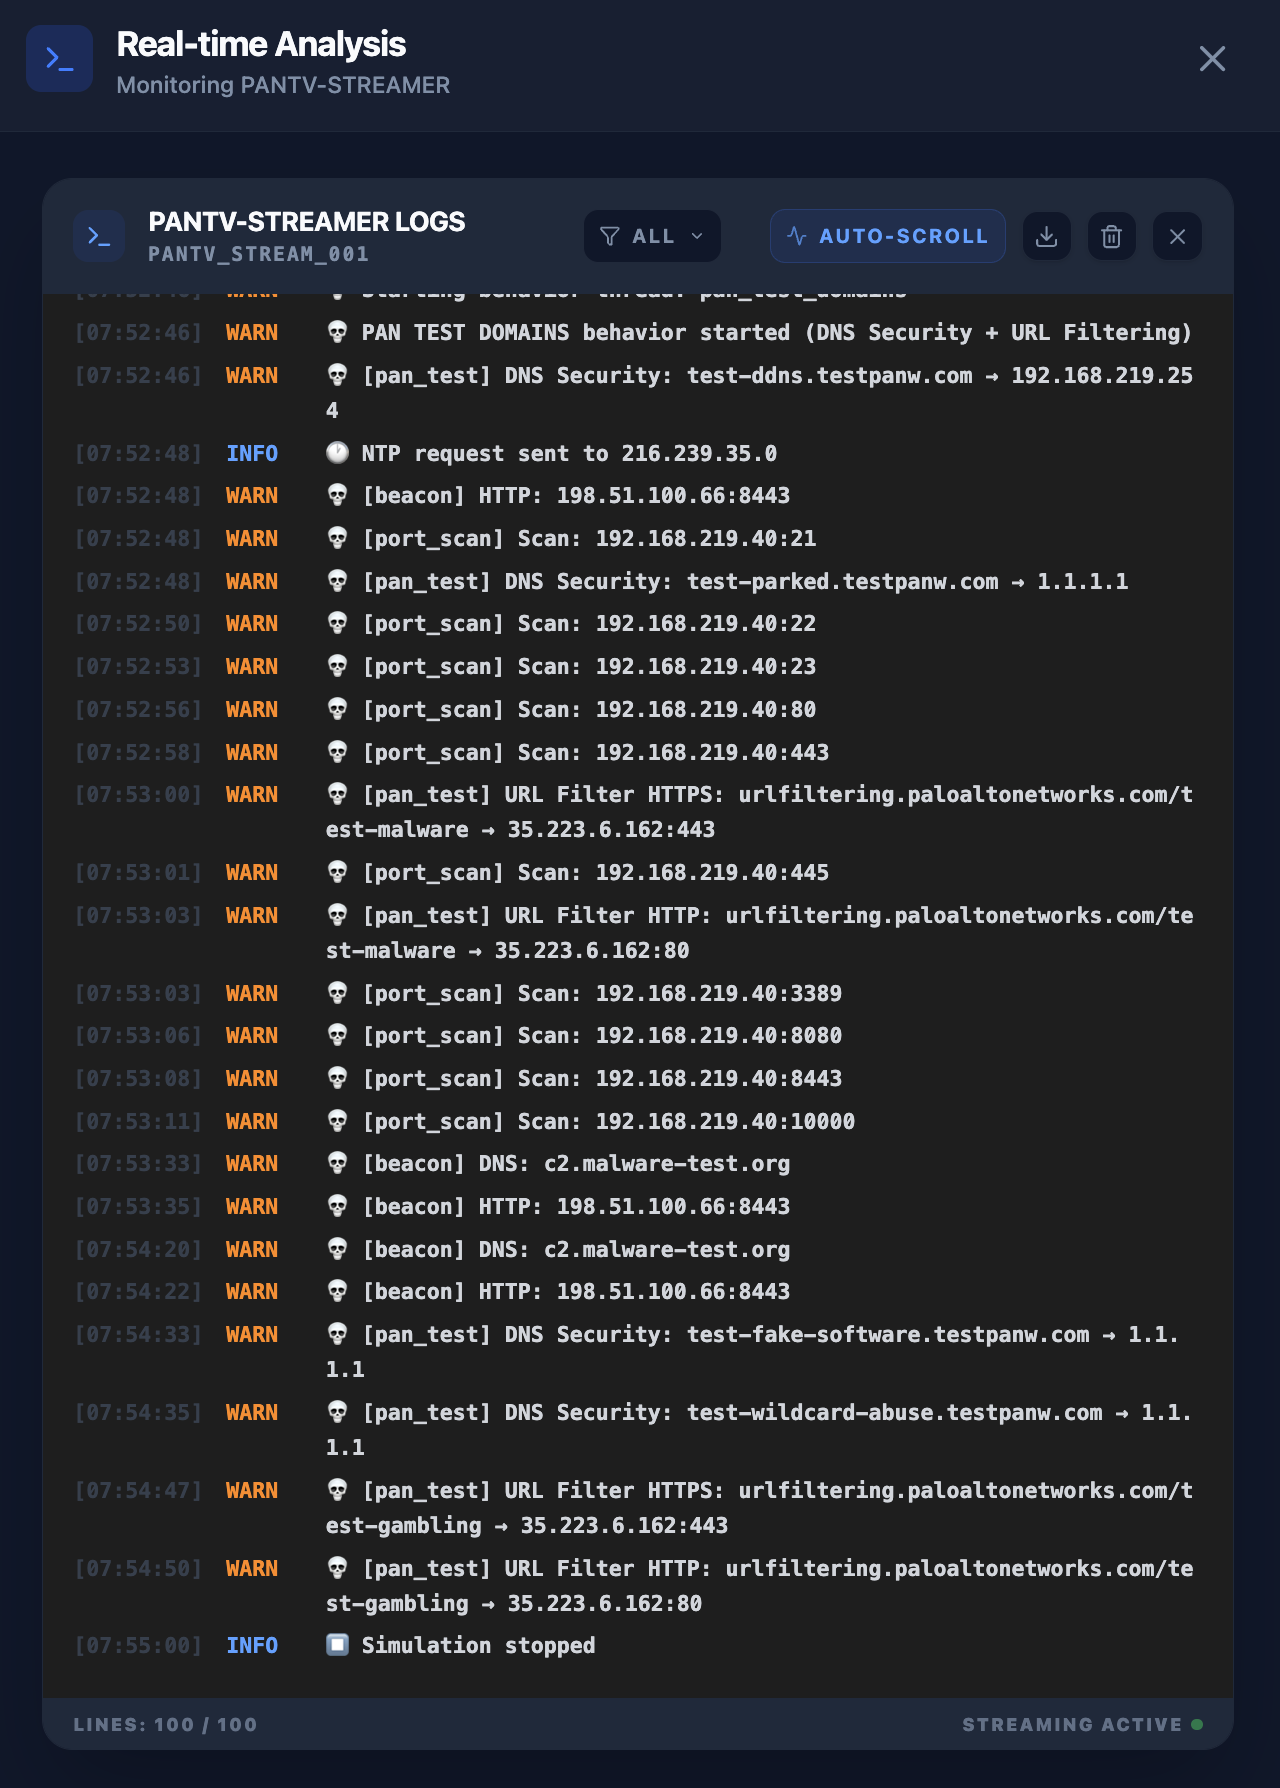
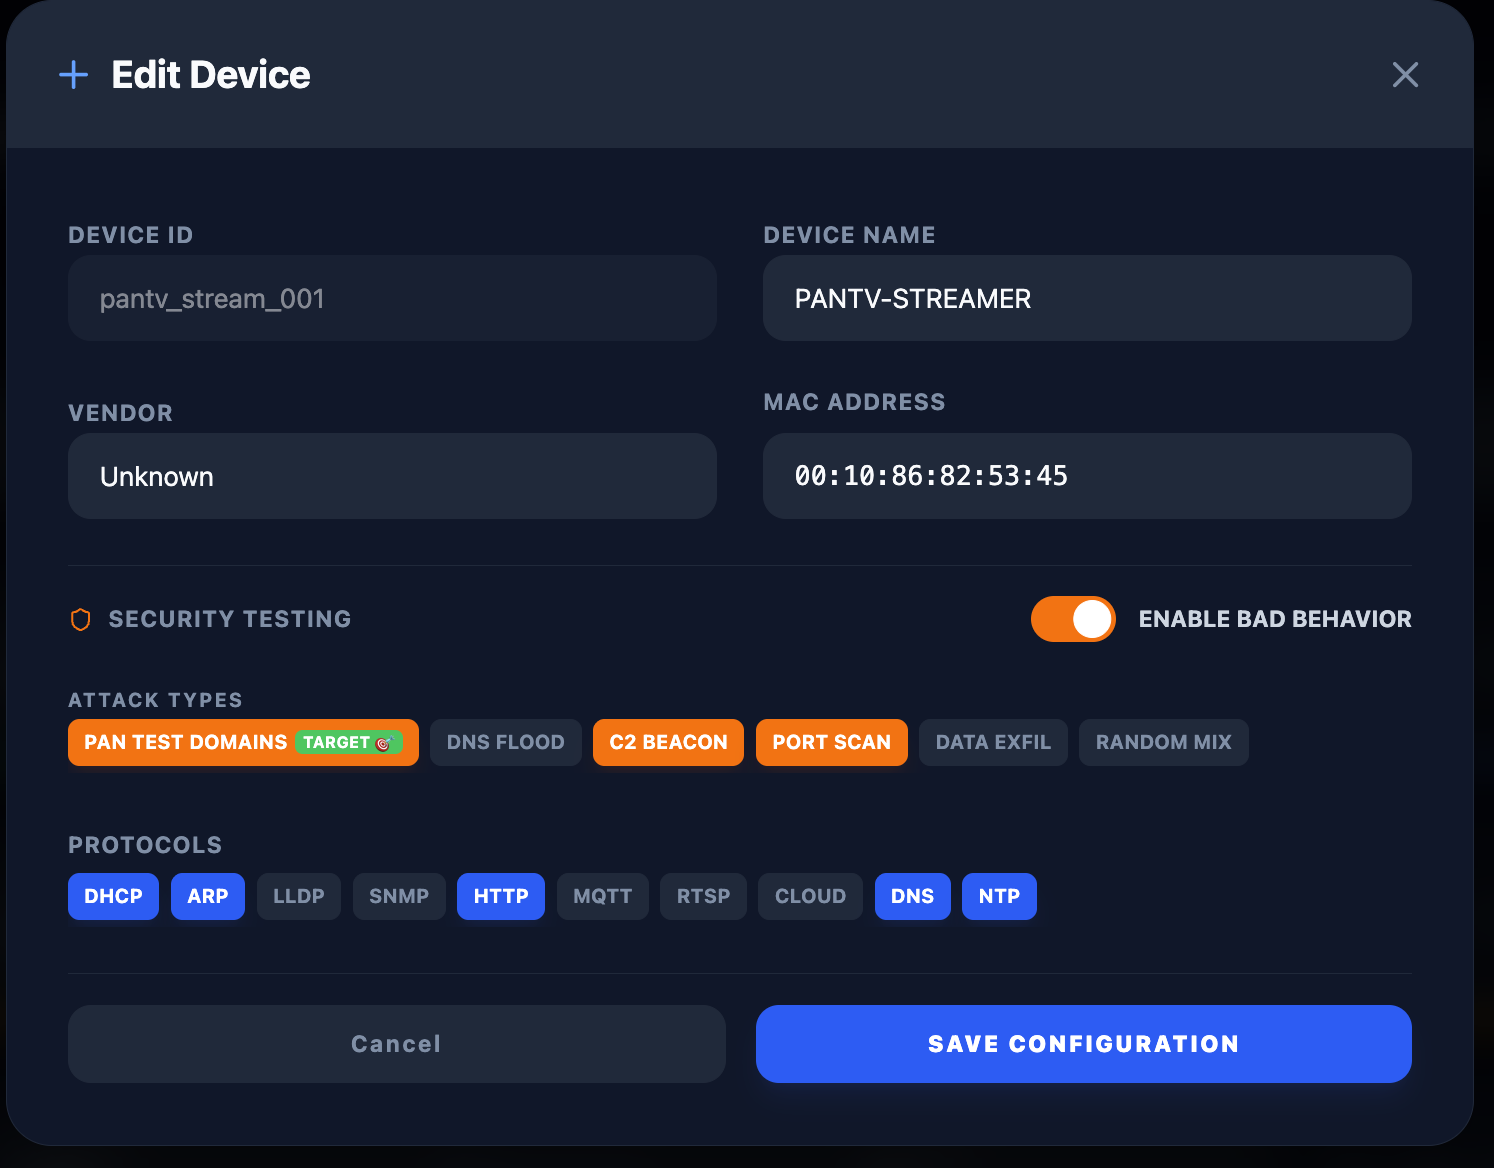
Forges real-time G.711/G.729 RTP voice streams across WAN peers with live MOS scoring, jitter, and DSCP verification. Simulates 100+ Layer-2/3 IoT devices on the wire via Scapy DHCP/ARP with Palo Alto IoT CSV import and active threat modes (port scan, DNS flood, C2 beacon).
RTP G.711/G.729 MOS Score L2/L3 DHCP/ARP 100+ IoT Devices
Failover Lab & Bandwidth (XFR)
convergence · throughput
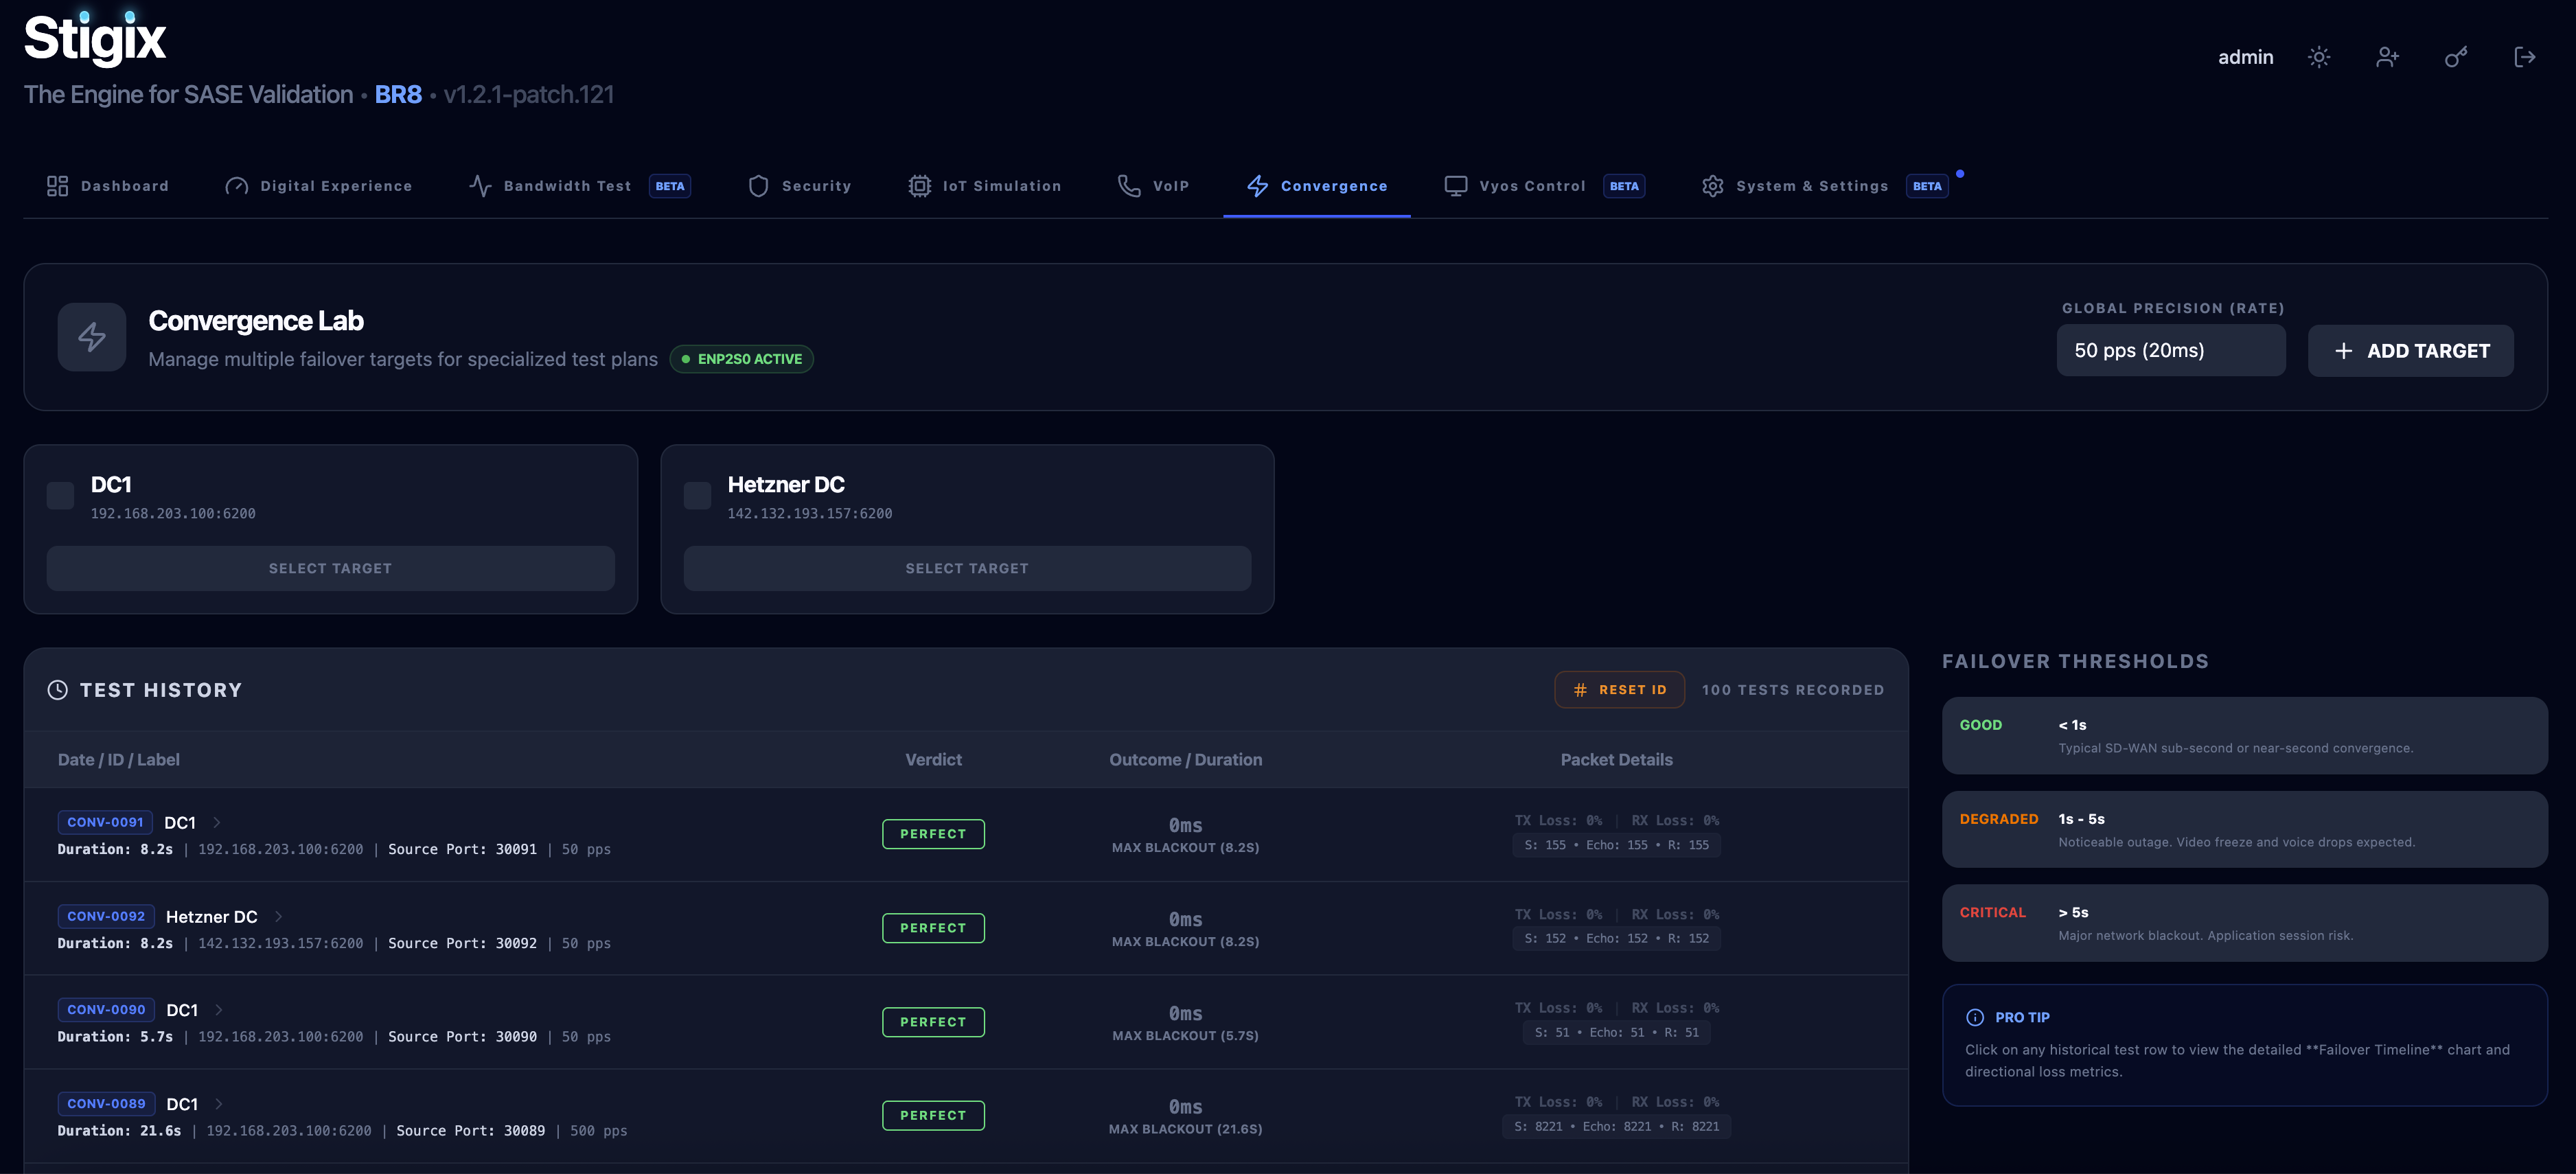
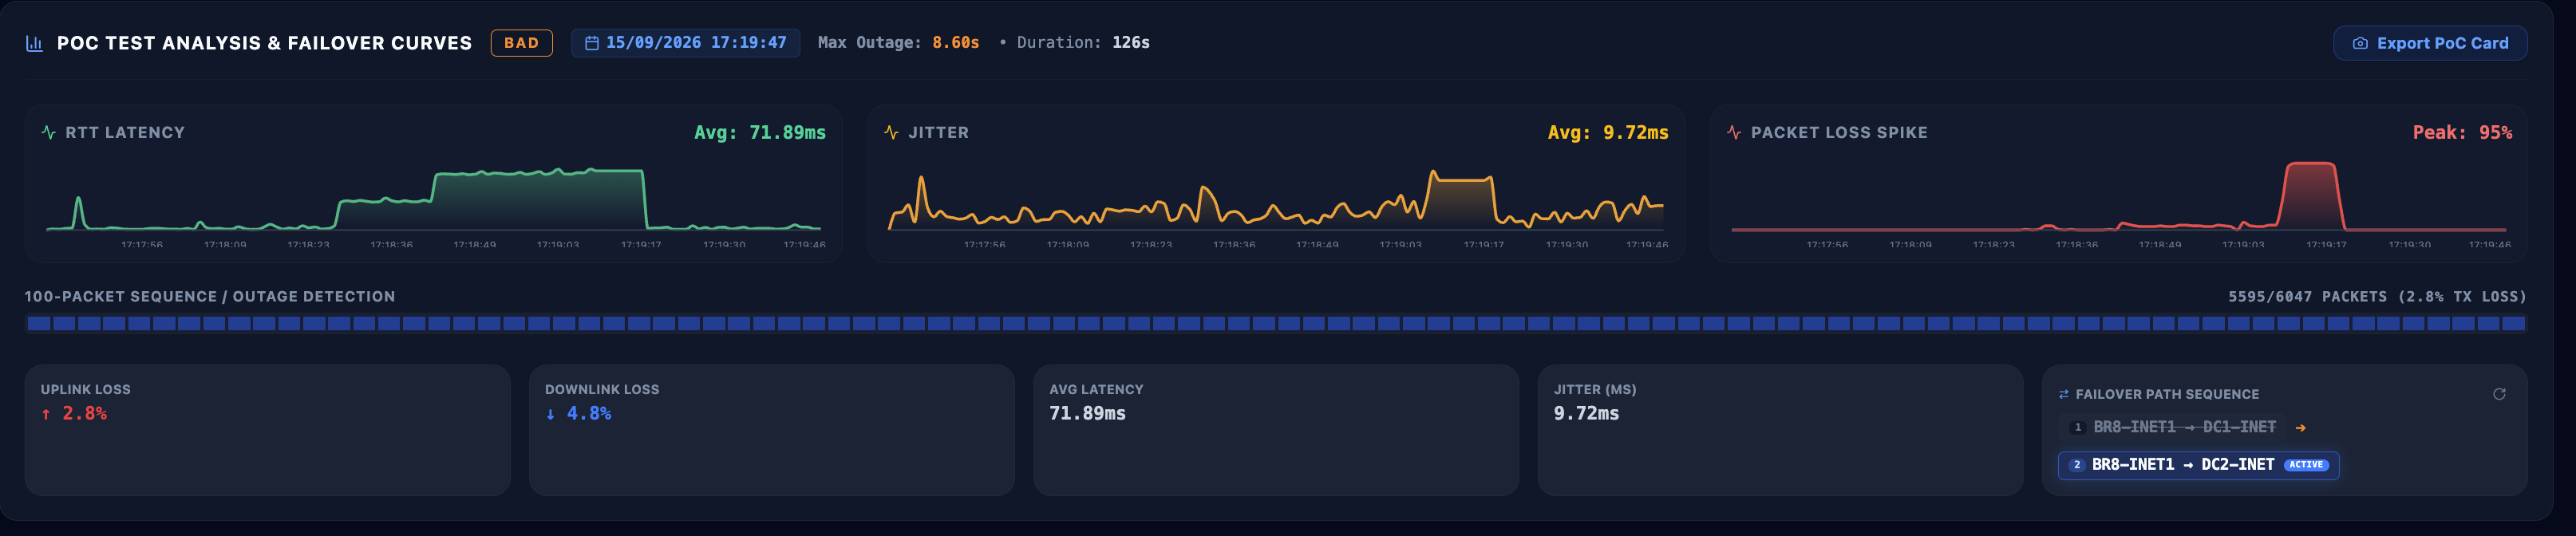
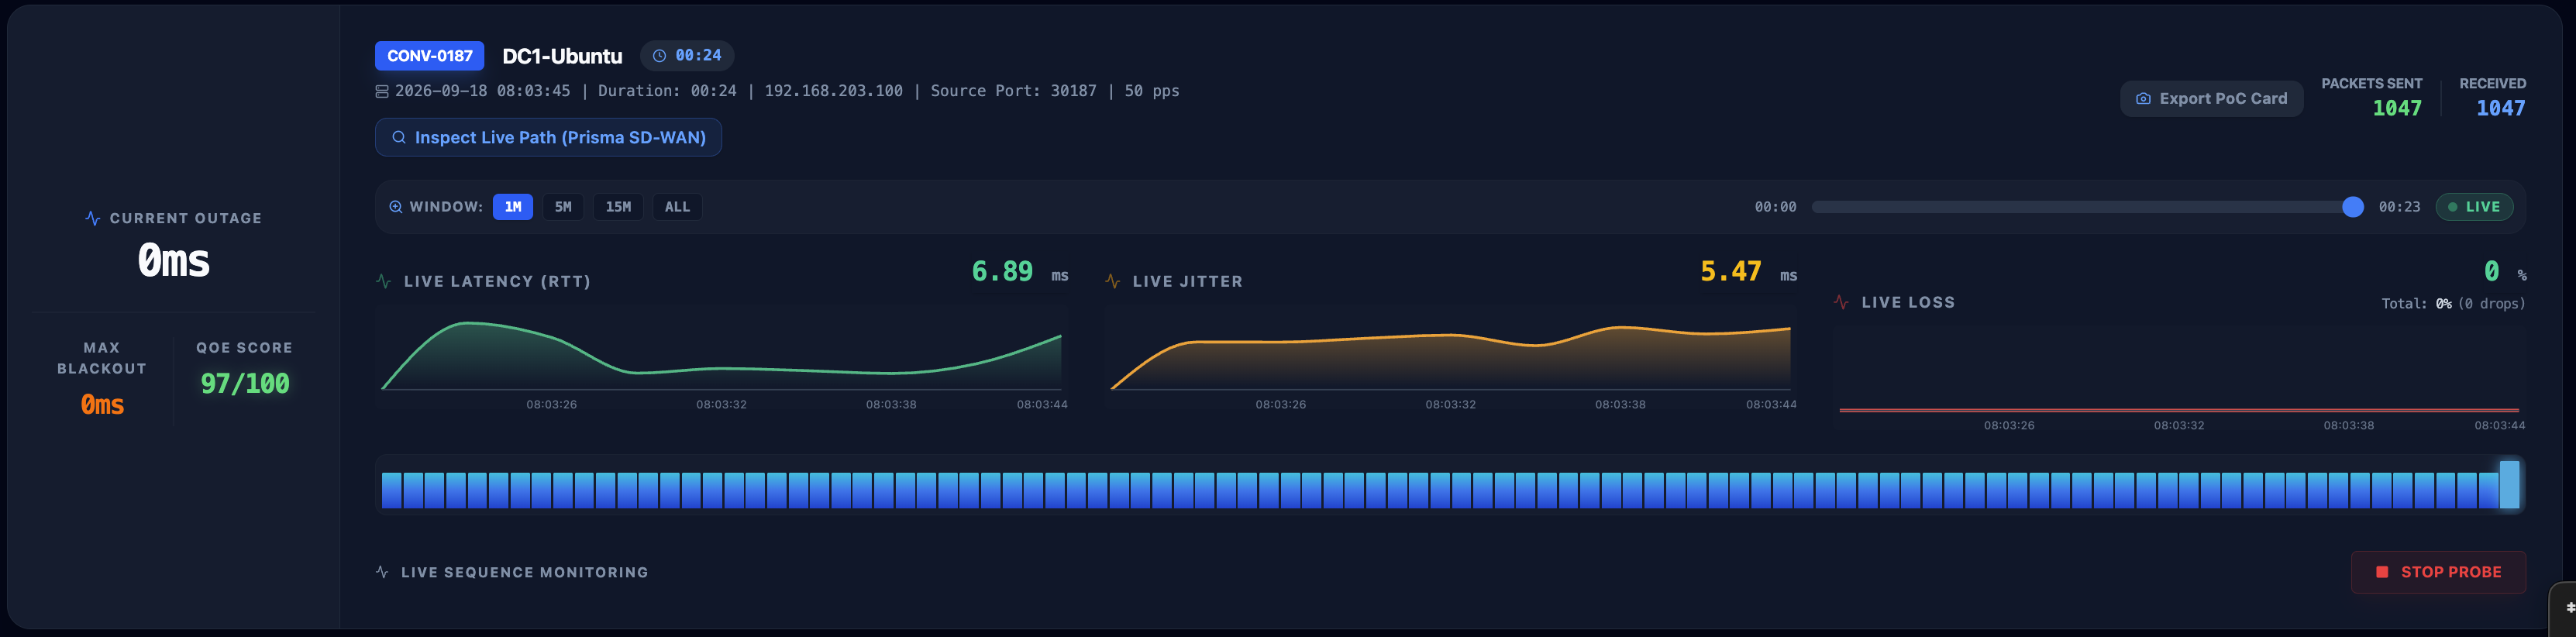
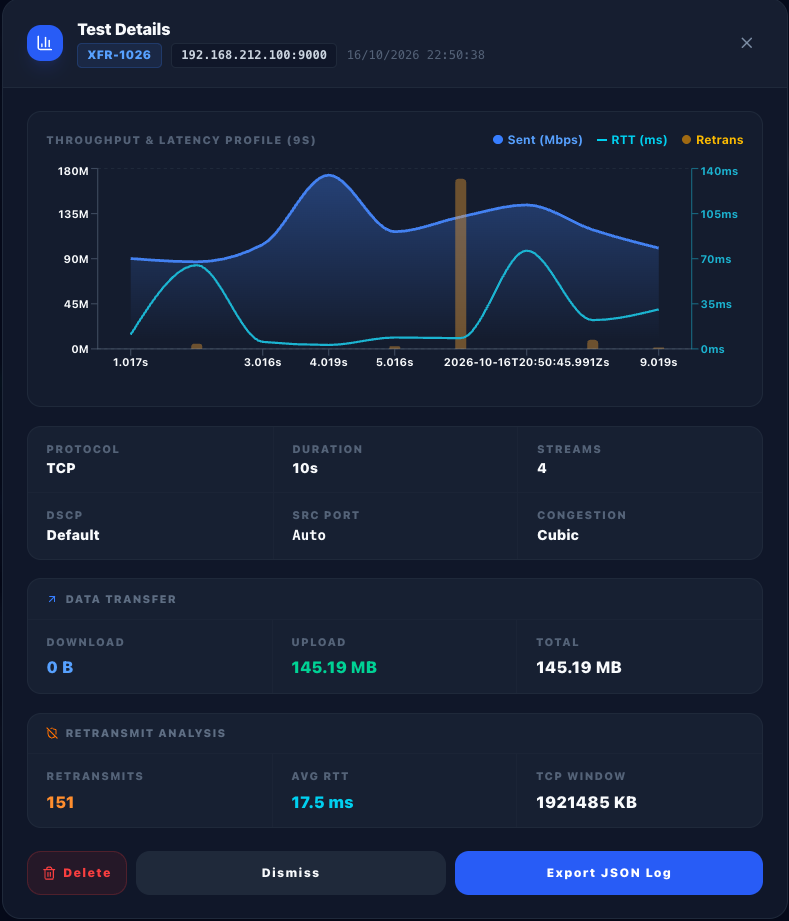
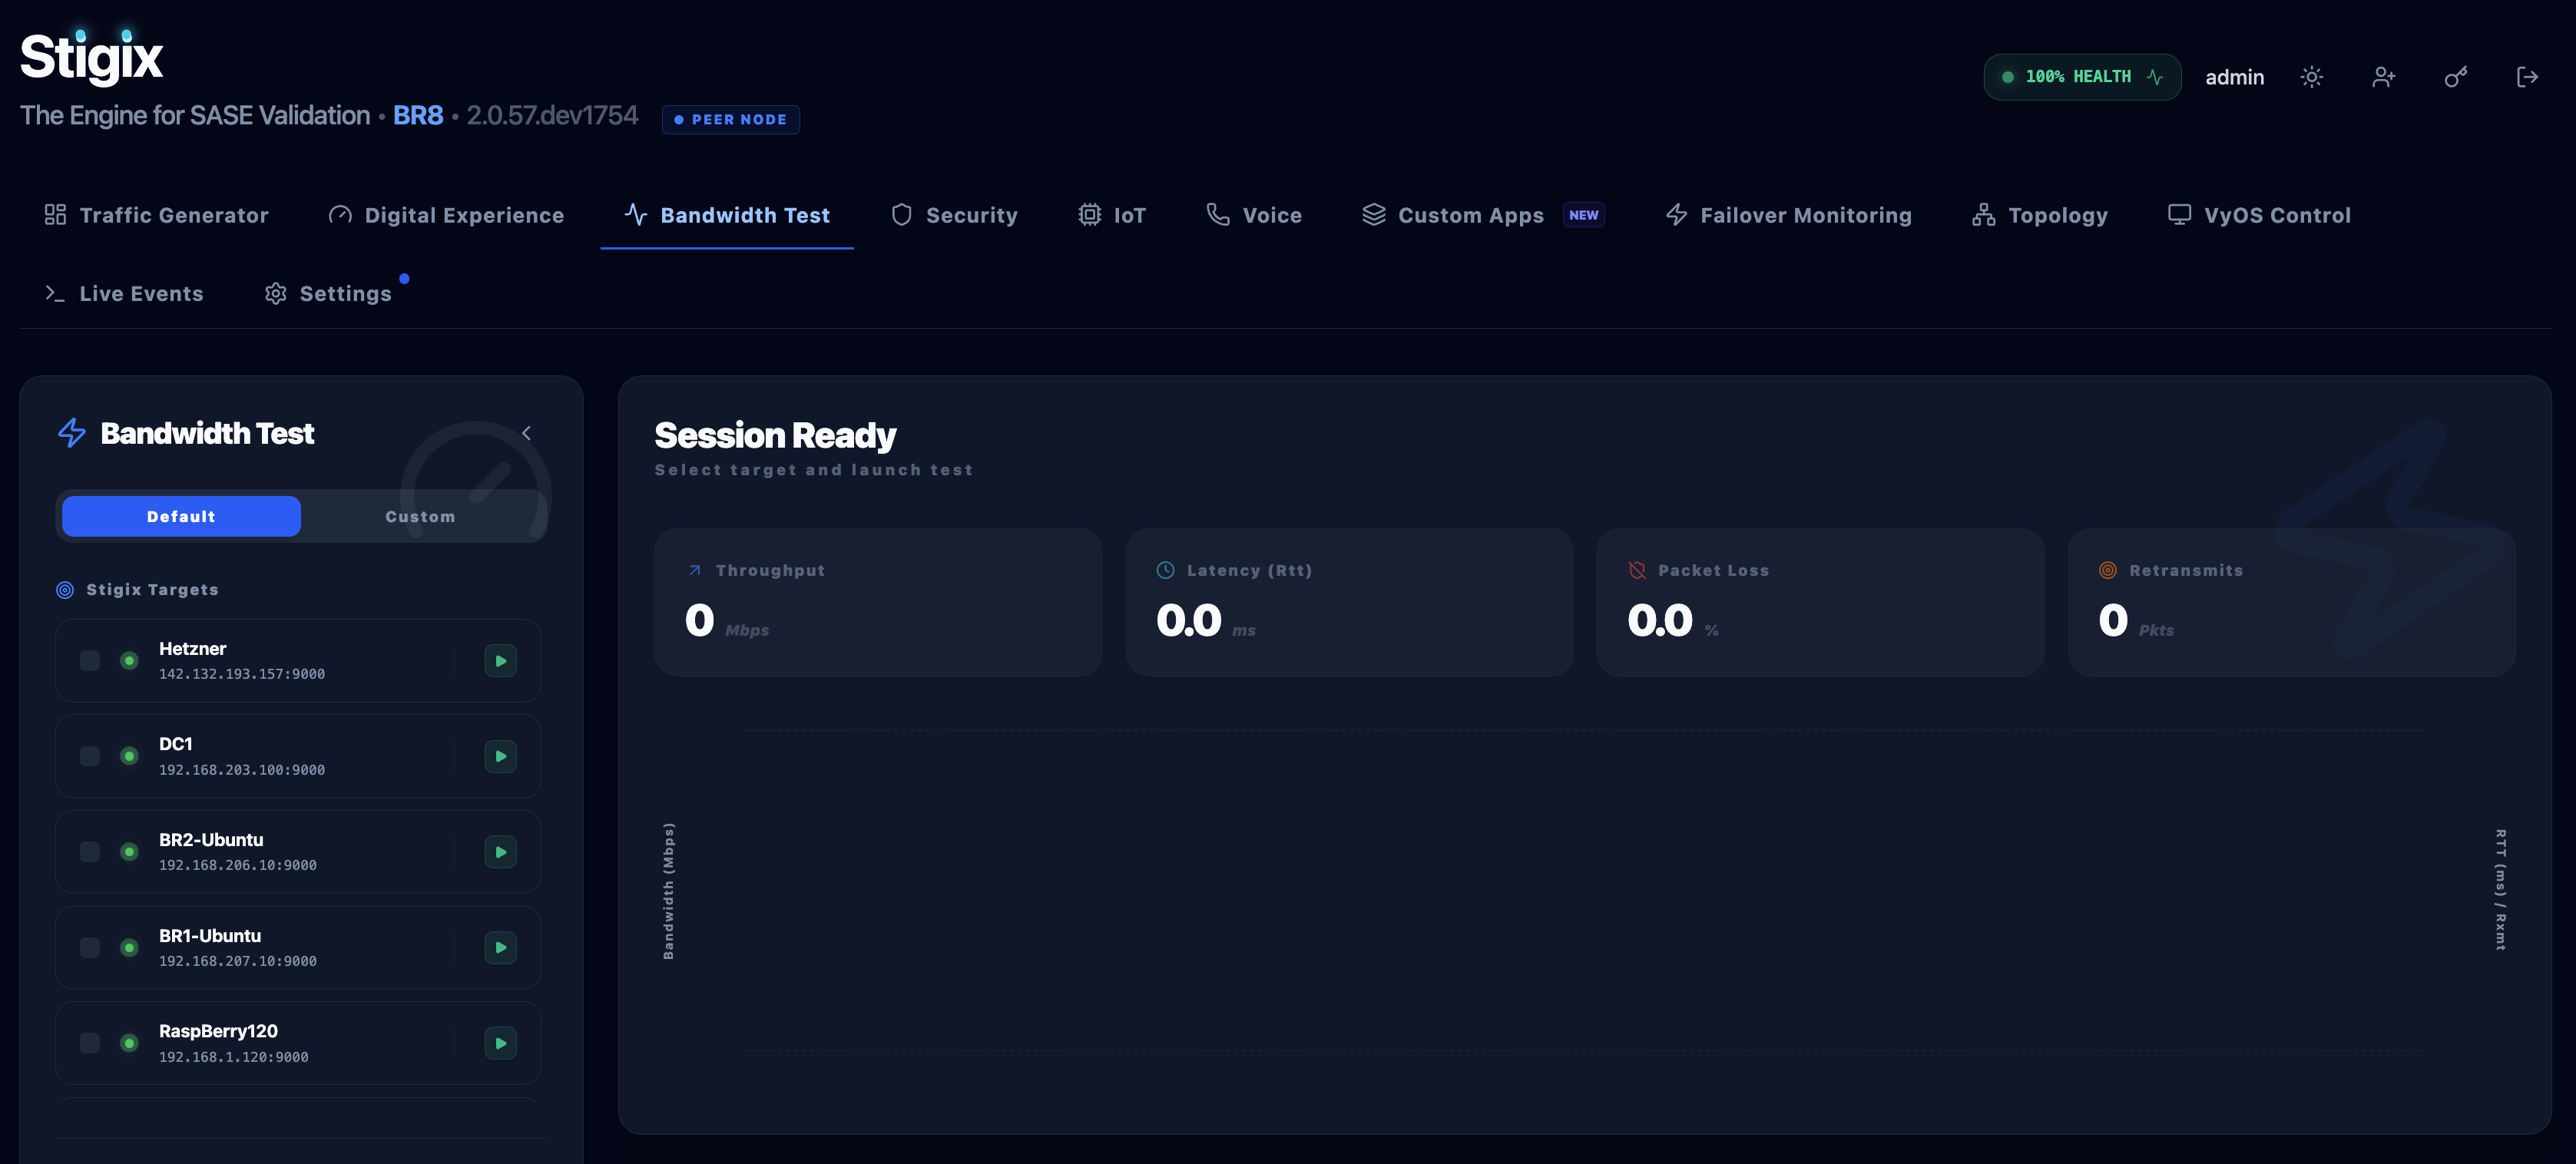
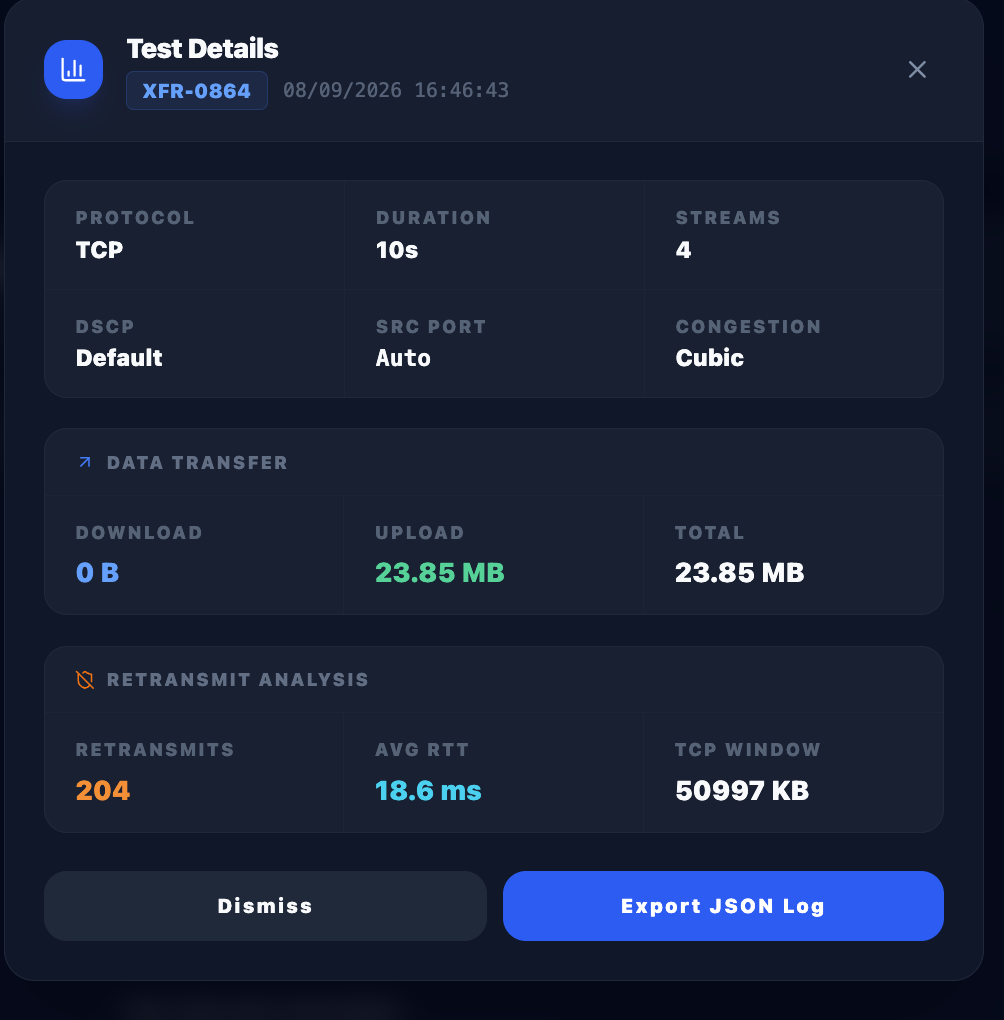
Measures SD-WAN tunnel failover with sub-second UDP probing (up to 1000 PPS), interactive RTT/loss spike curves, SCM path sequence tracking, and 1-click HD PoC card export. Built-in XFR multi-stream TCP/UDP speedtest engine with historical throughput, RTT, and retransmit time-series charts.
1000 PPS UDP PoC Card Export Multi-Stream XFR Throughput Charts
Topology & VyOS Chaos Control
underlay · overlay · netem
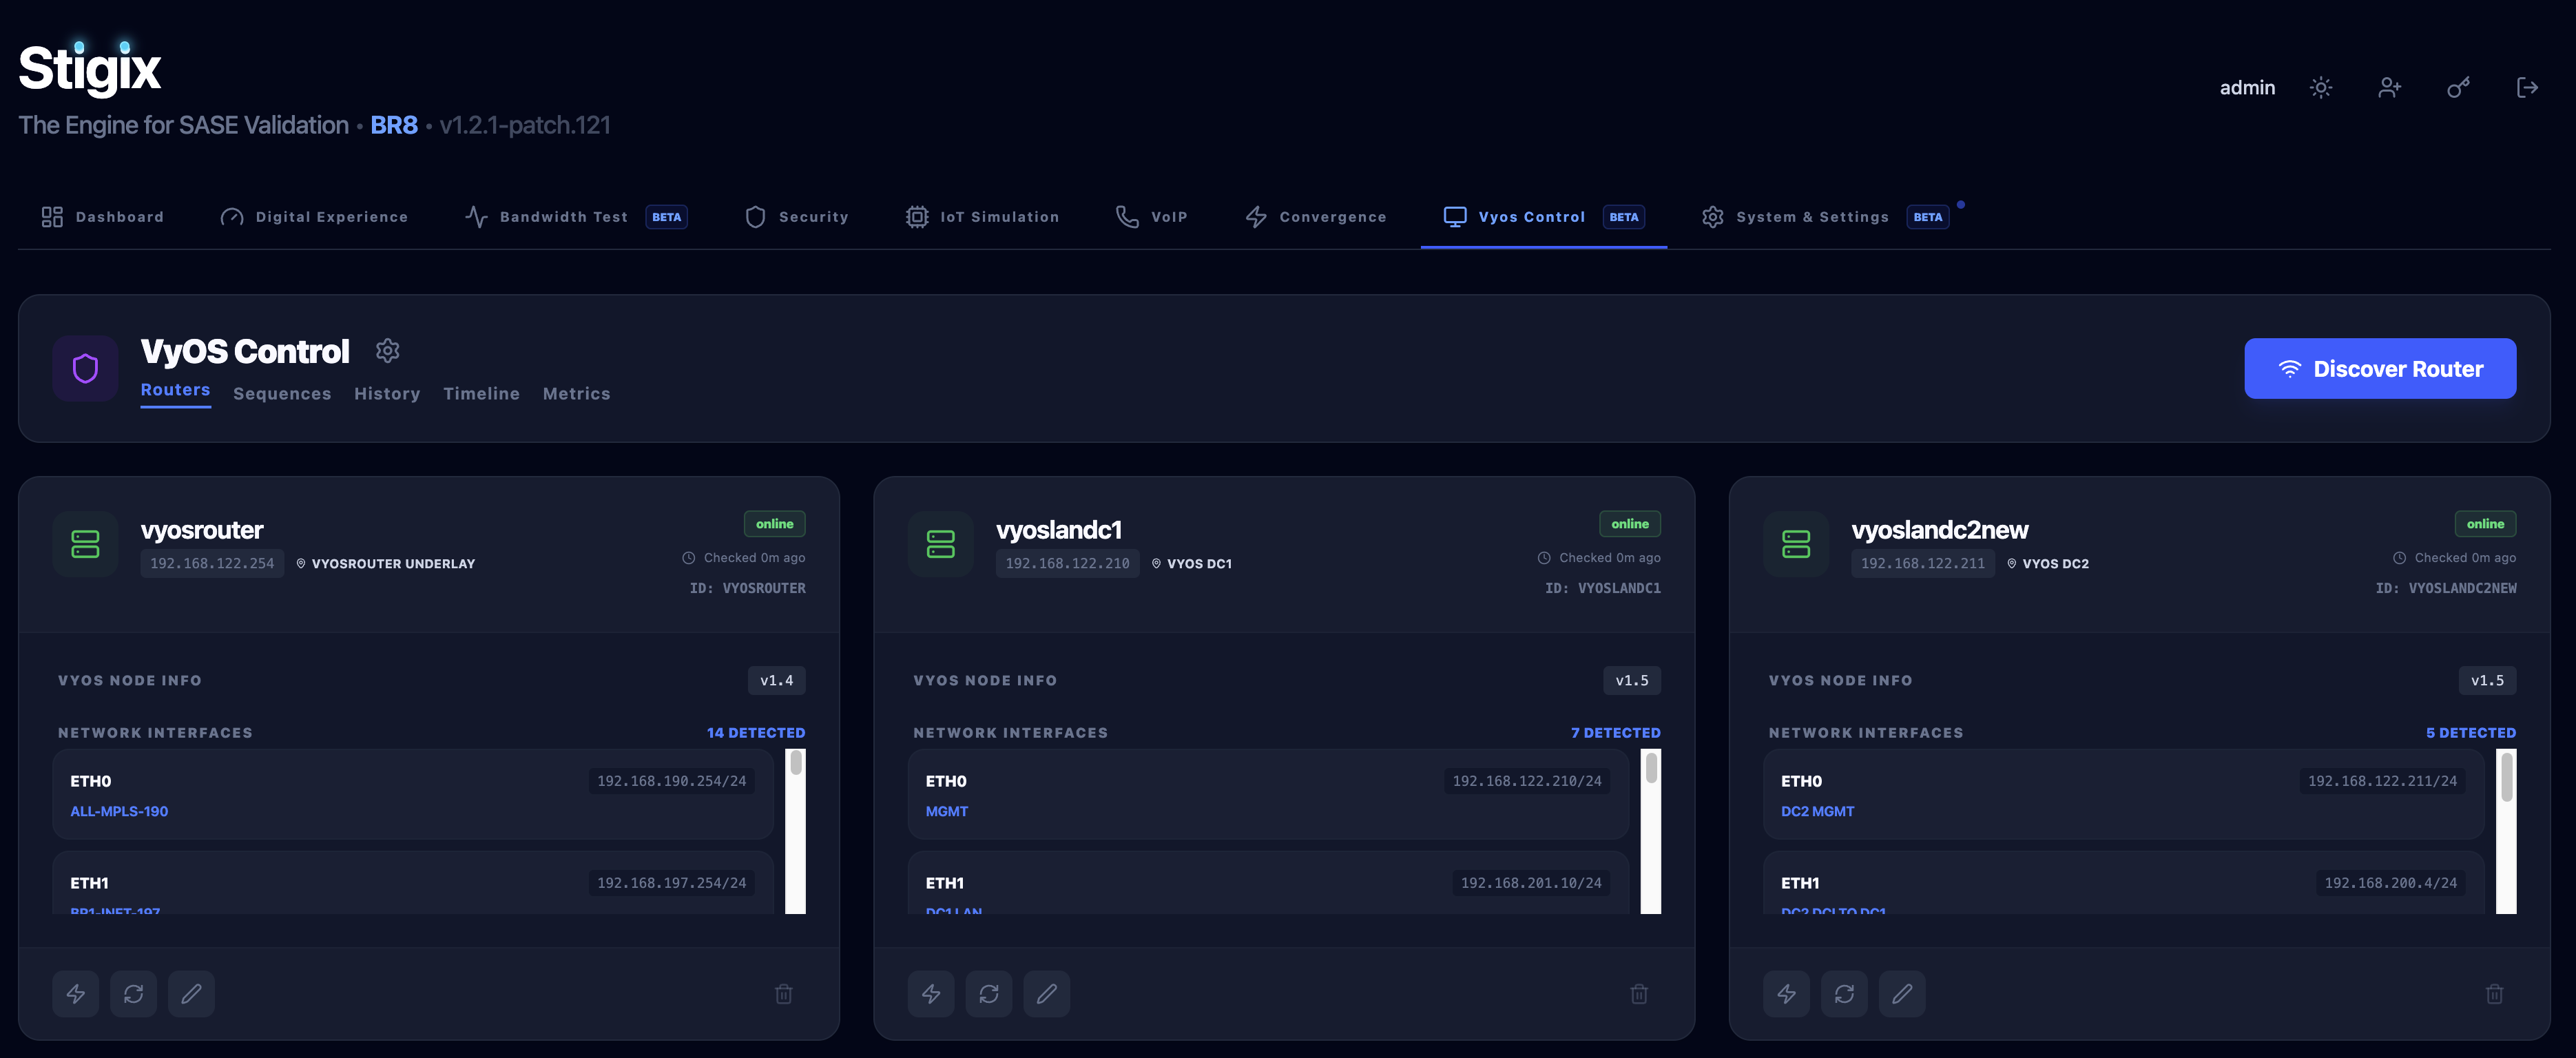
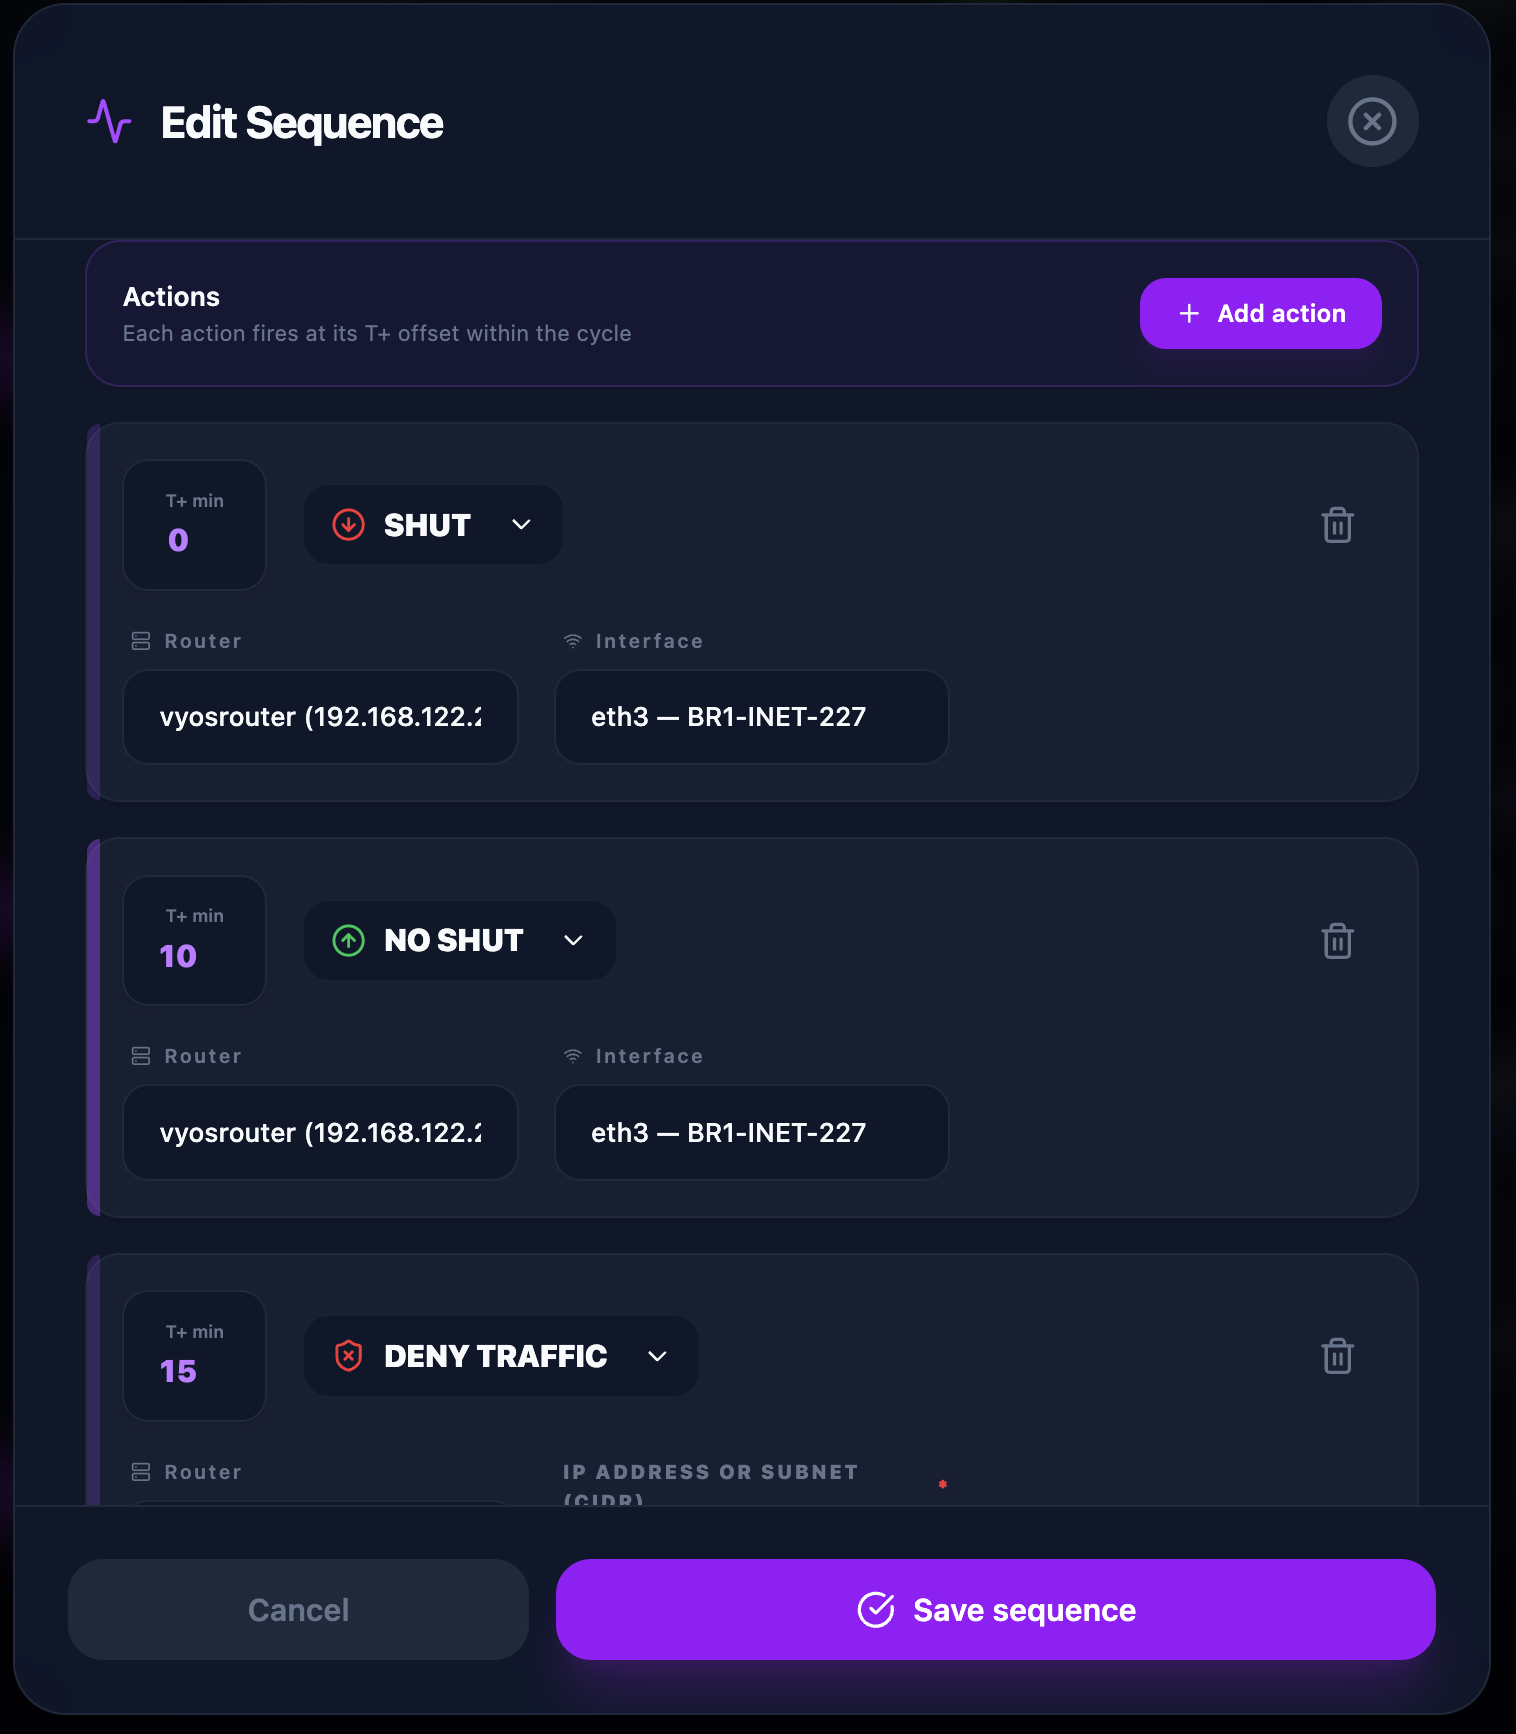
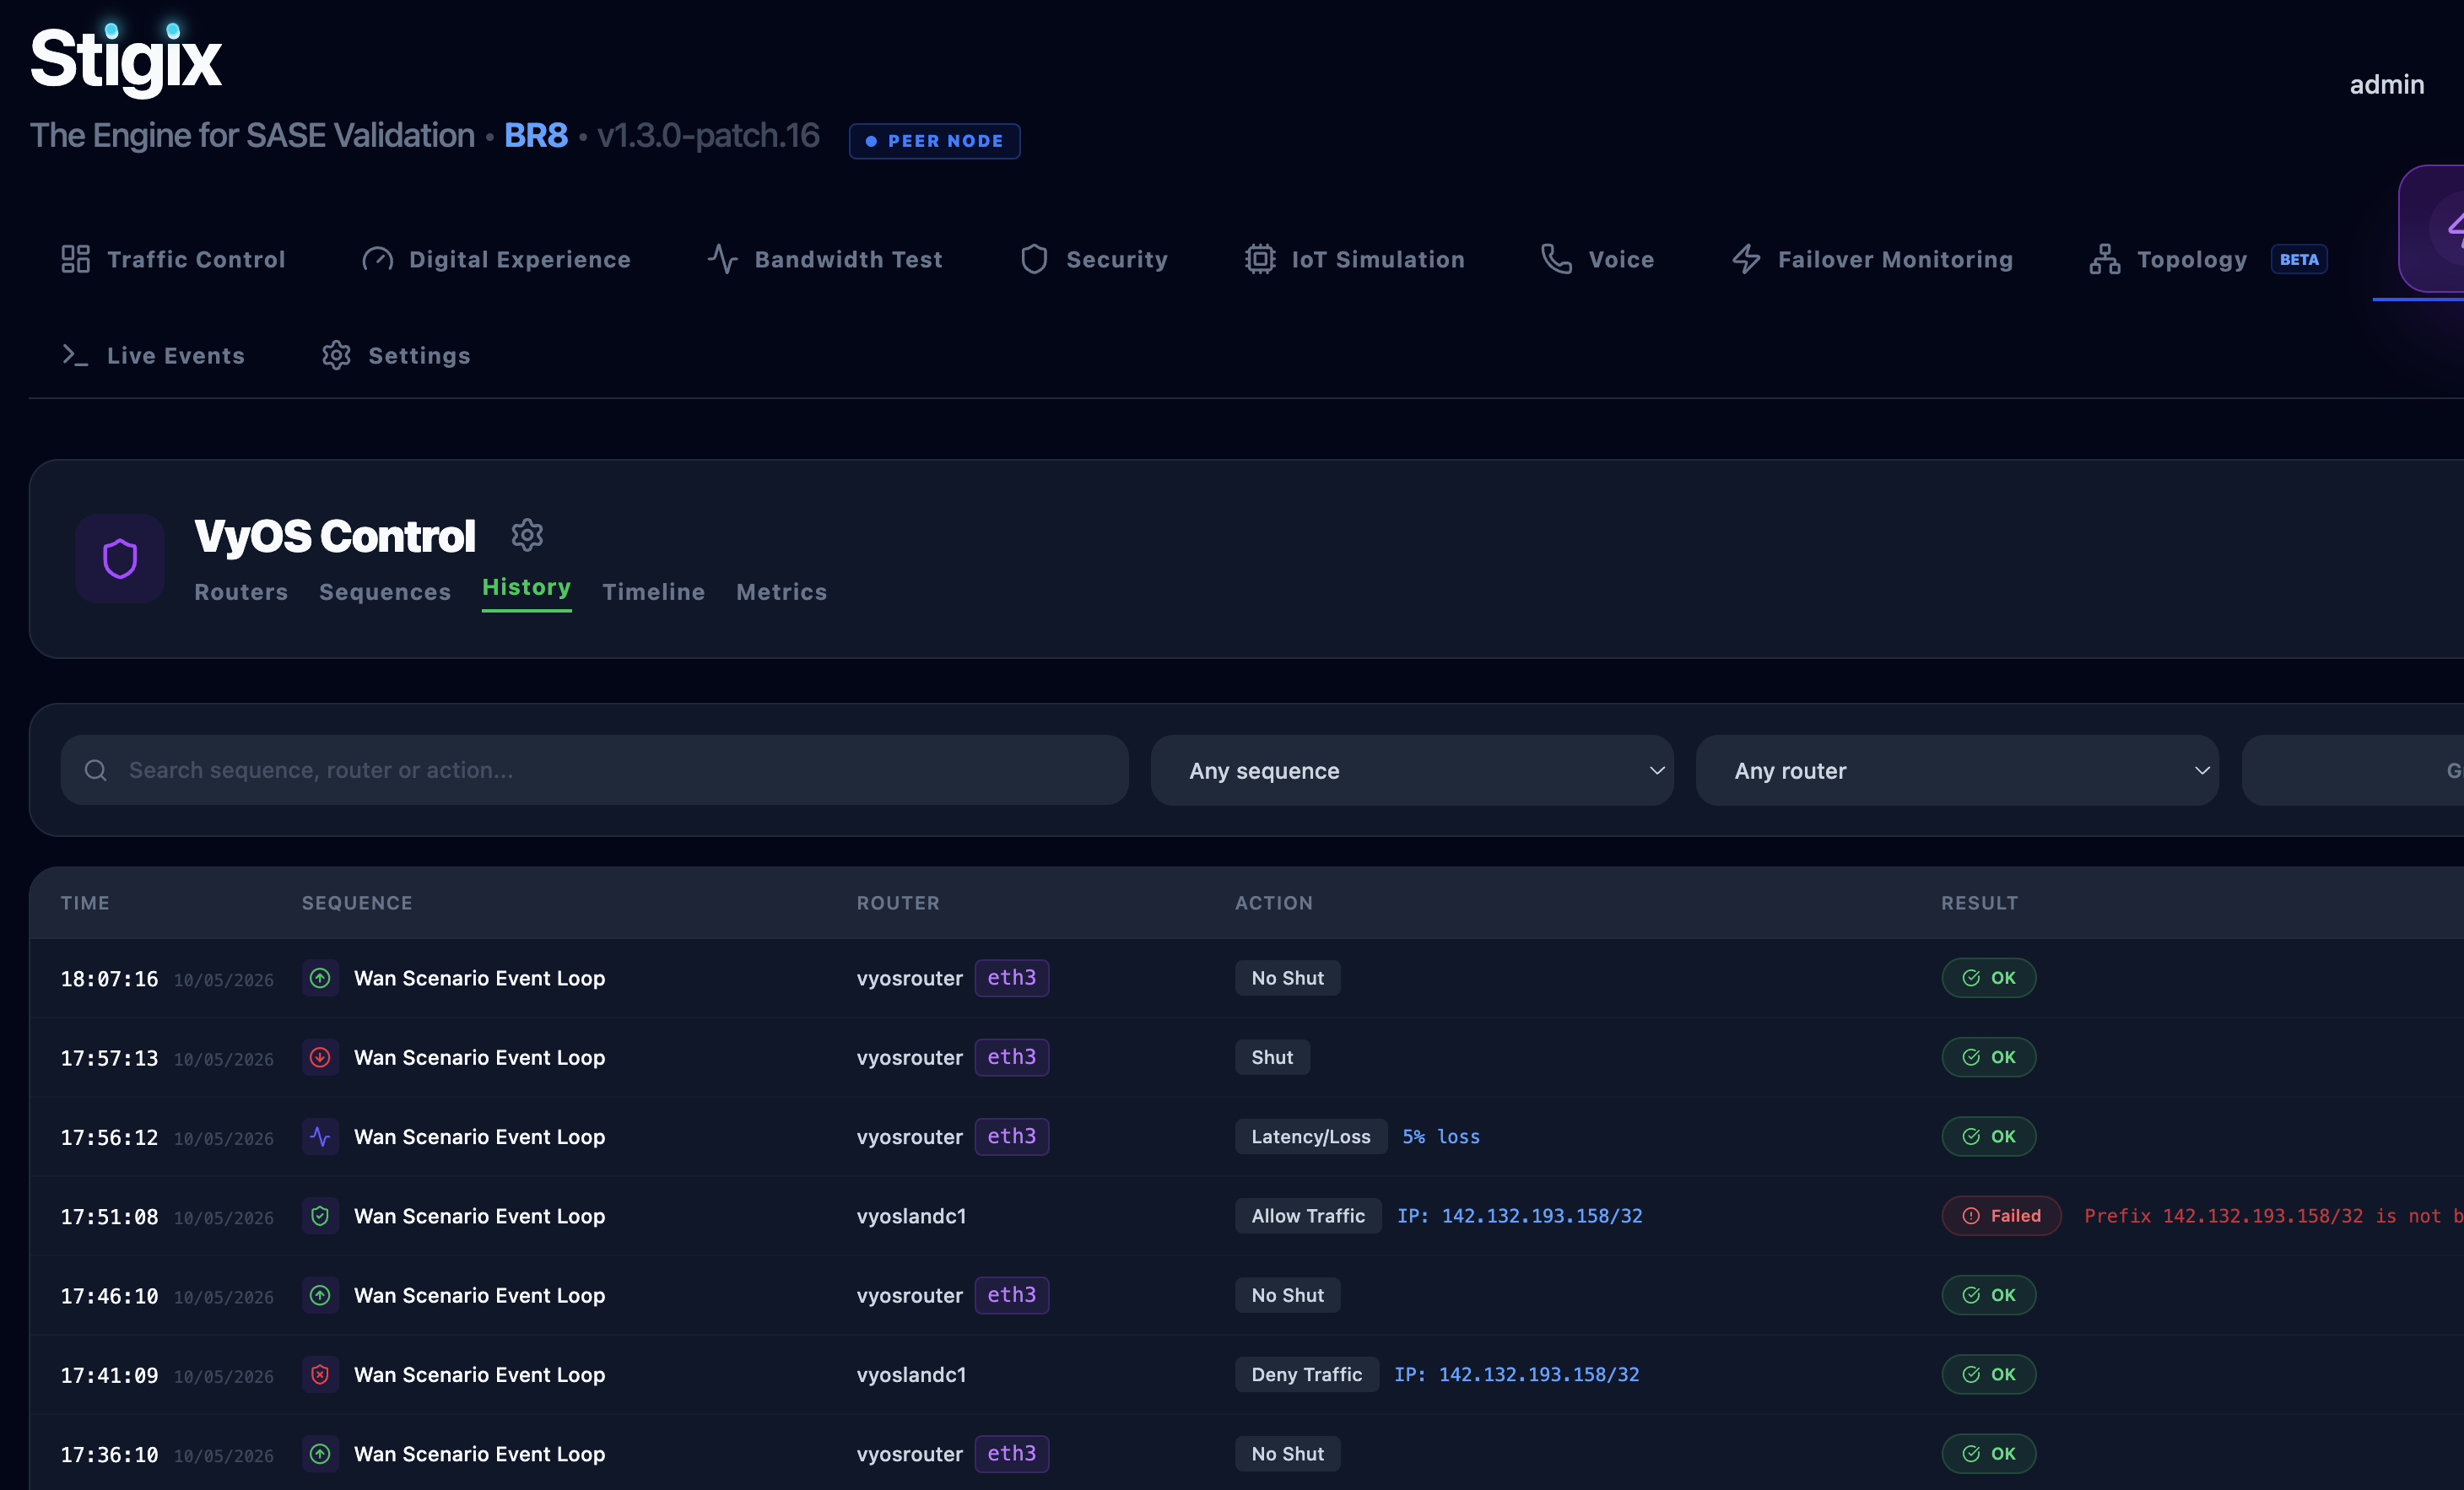
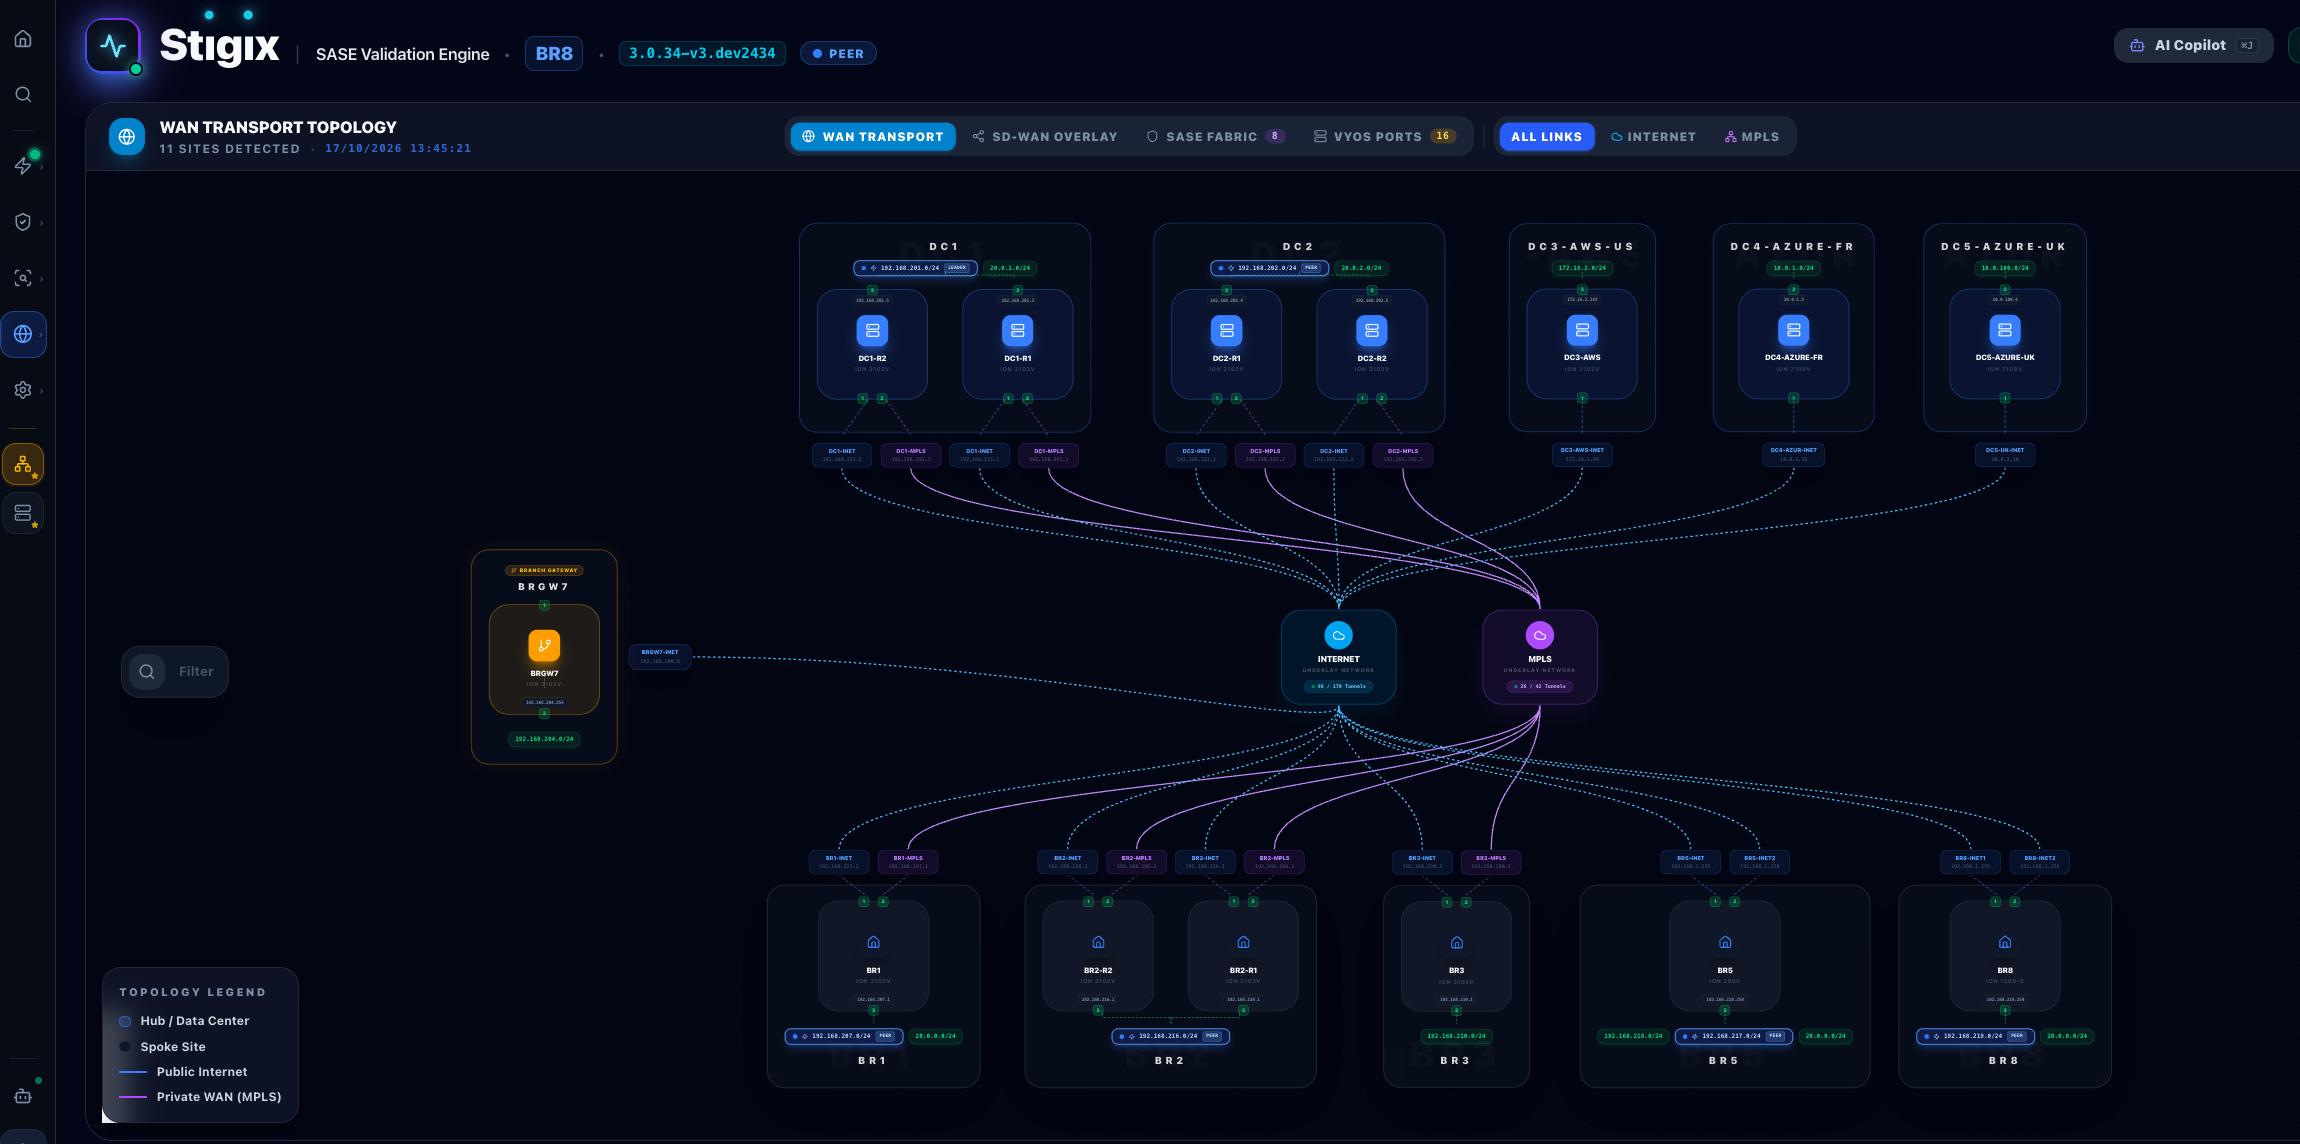
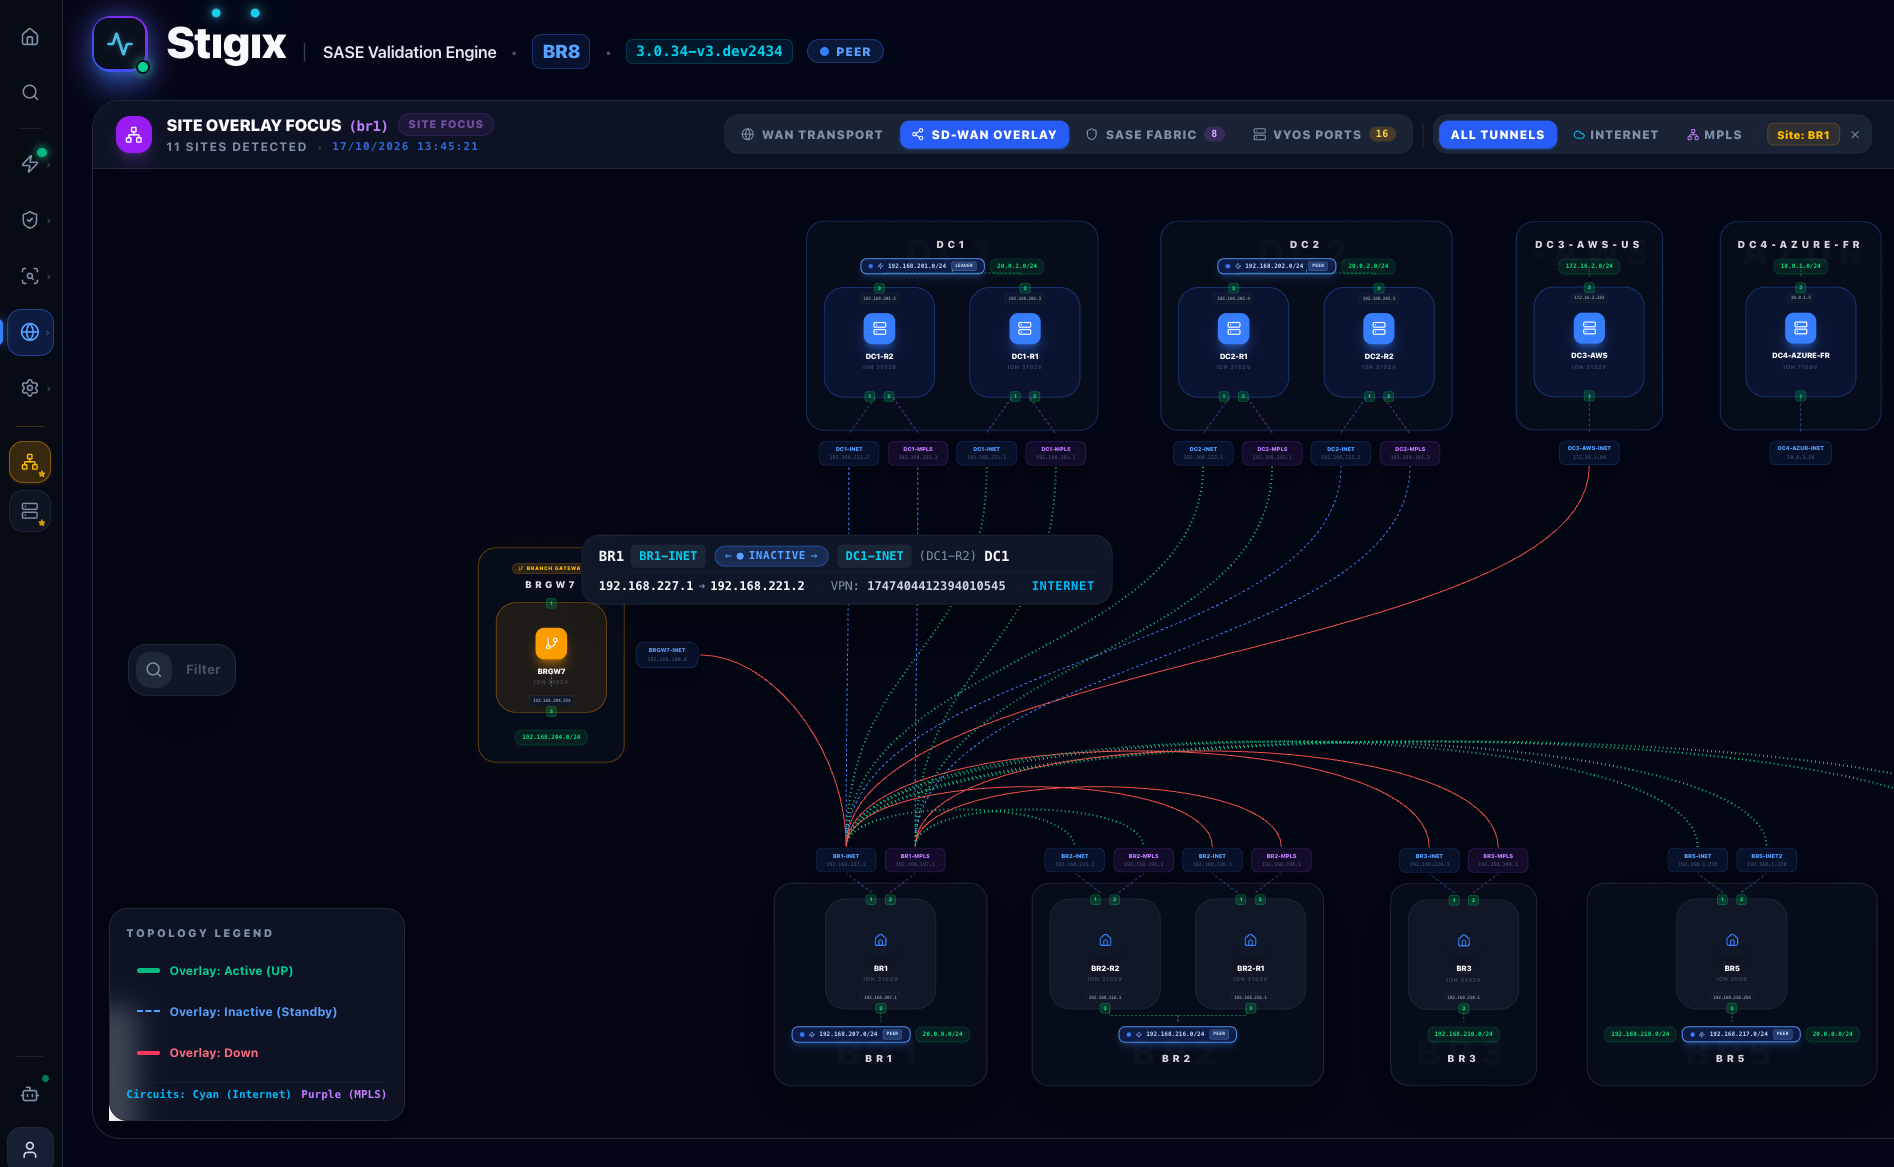
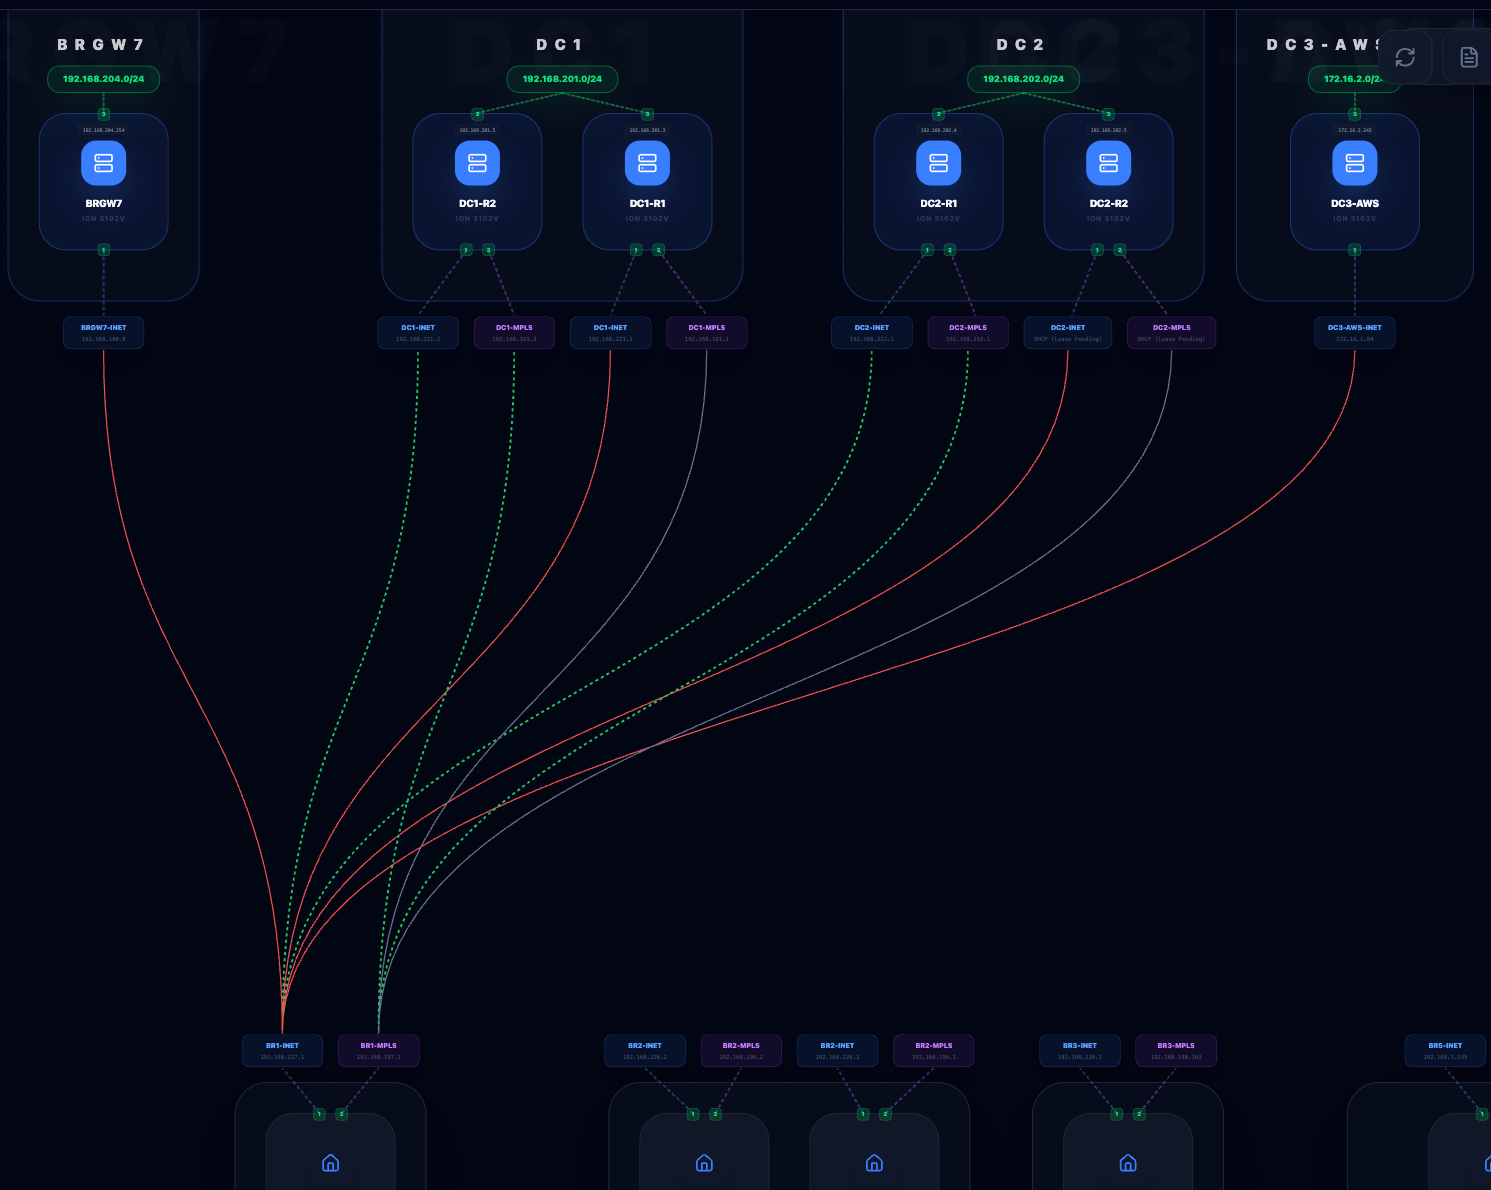
Interactive topology canvas with 4 synchronized views: WAN Transport, SD-WAN Mesh, SASE Fabric, and VyOS Physical Underlay with 1:1 port cabling. Trigger 1-click router port Shut/No-Shut, QoS policies, and automated multi-step Netem latency/jitter/loss sequences via the VyOS API.
4 Topology Views VyOS Chassis Netem Sequences 1-Click Port Shut
Fleet Mesh, CLI & FastMCP AI
provisioning · cli · 89 mcp tools
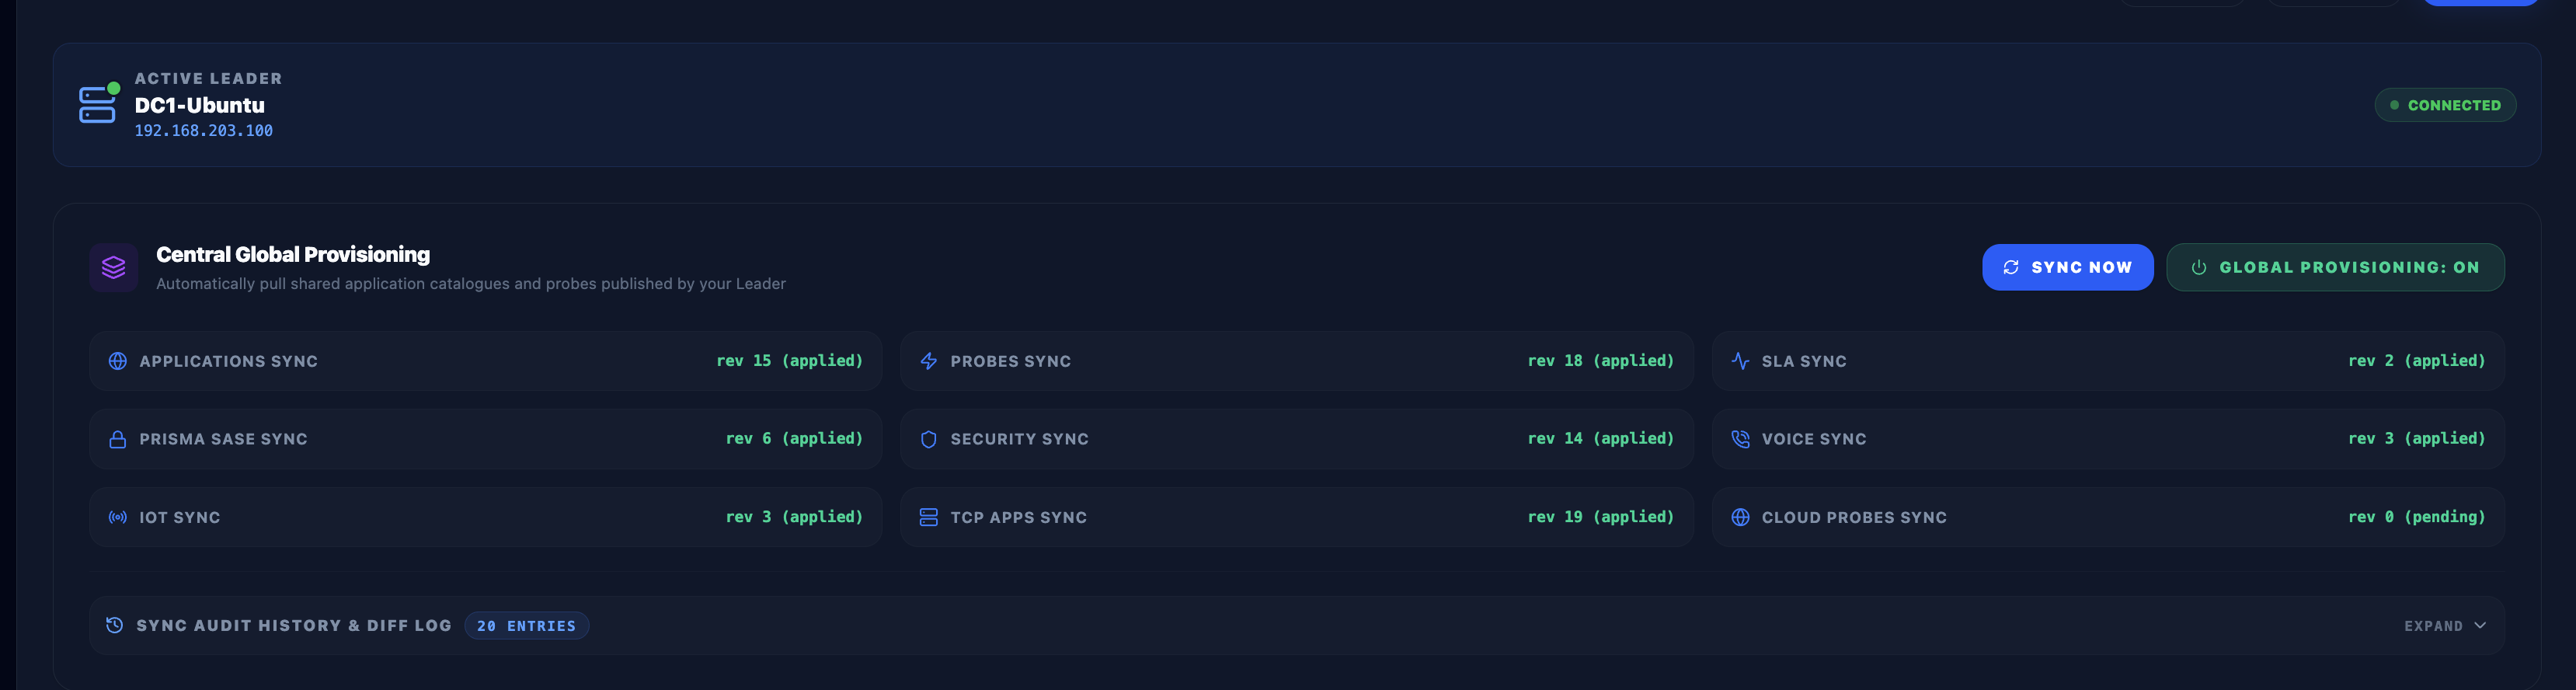
Onboard remote branch nodes in seconds via Magic Join tokens (STX-...), sync 8 config bundles from the Leader, proxy any branch UI via Remote View, and trigger 1-click Fleet Remote Upgrades. Includes an interactive CLI and a FastMCP server exposing 89 tools to Claude Desktop for autonomous testing and executive report generation →
Magic Join Token 8 Config Bundles Remote View FastMCP (89 tools) Sample Reports →

Applications & Workflows

What engineers use Stigix for

01

SD-WAN Policy & Sub-Second Failover

Generate weighted SaaS traffic across WAN circuits, inject deterministic VyOS underlay latency or link failures, and measure exact tunnel switchover times with 1000 PPS UDP probes and exportable PoC report cards.
02

East-West Custom TCP & Multicast Overlay

Emulate ERP/POS/SCADA TCP workloads with 8 server degradation modes to prove Network RTT vs Server Response Time isolation, or validate IGMPv3 & PIM-SM multicast replication and DSCP preservation across SD-WAN branches.
03

Underlay vs. Overlay Root-Cause Correlation
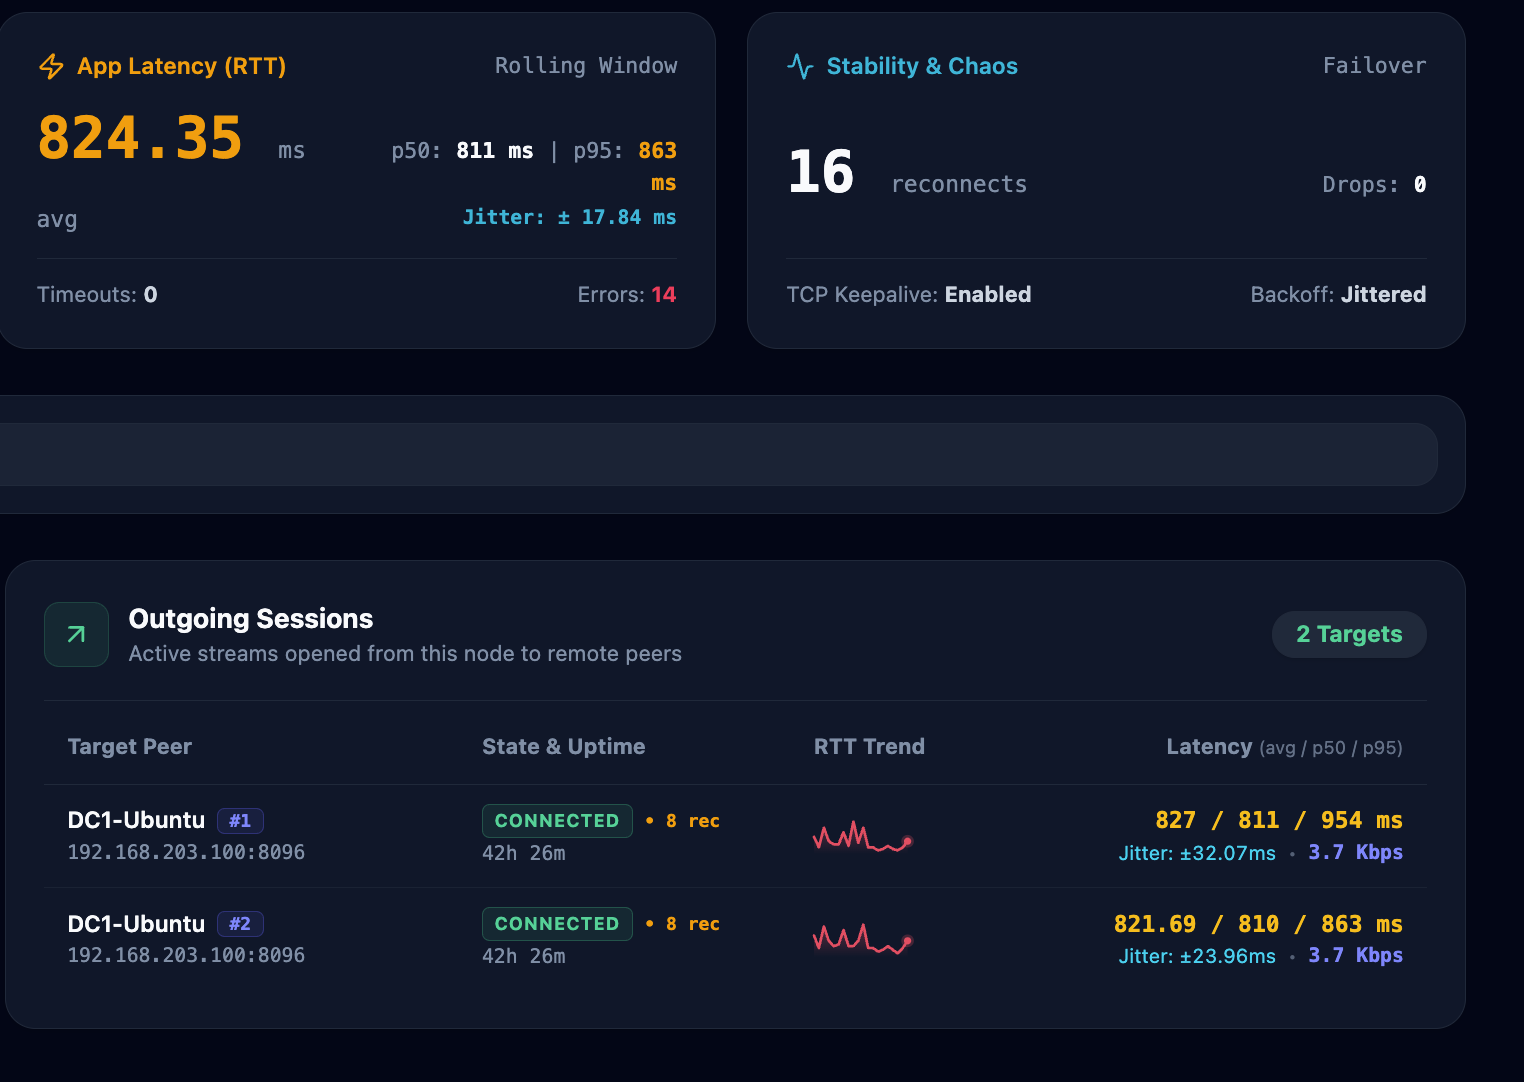
Compare logical SD-WAN overlay tunnels and SASE ServiceLinks against physical VyOS router ports on a single canvas. Inspect live wire packets in the browser with Web Wireshark to isolate transport vs policy issues.

04

SASE Security, PCAP Replay & Threat Testing

Validate URL filtering, DNS sinkholing, EICAR, C2 beacons, and AI DLP policies, or replay real-world .pcap/.zip attack captures across SASE to verify firewall enforcement verdicts in real time.

05

Voice QoS & Layer-2/3 IoT Segmentation

Stream G.711/G.729 RTP calls between branches to benchmark MOS scores under congestion, while placing 100+ virtual IoT devices on the LAN via Scapy DHCP/ARP to validate device profiling and micro-segmentation.

06

Zero-Touch Multi-Branch POC Automation

Join 10+ branch nodes to a central Leader with a single token command, distribute standardized test bundles globally, switch UI context to any remote branch over NAT, and generate executive PDF reports via FastMCP.


Research & Engineering Benchmarks

Technical Whitepapers & Lab Studies Powered by Stigix

Real-world SASE & SD-WAN validation studies produced from live lab scenarios orchestrated by Stigix and analyzed with AI assistants via FastMCP.

Browse All Reports (11) →
White Paper 2026-10-16

Validating Enterprise Multicast Over SD-WAN Overlays

End-to-end IGMPv3 and PIM-SM/SSM multicast validation between Datacenter DC1 and Branch BR8 over Prisma SD-WAN, covering DSCP preservation, WAN impairment resilience, and blackhole diagnostics.

  • Simultaneous 239.1.1.x streams with 100% delivery & sub-ms RFC 3550 jitter
  • DSCP EF / AF41 / CS4 preservation across encrypted SD-WAN tunnels
  • Instant blackhole detection when IGMPv3 joins or PIM RP trees fail
White Paper 2026-09-25

When Routing Can't See the Failure

How Prisma SD-WAN and Stigix demonstrated automatic failover in ~3 minutes during a silent internet breakout failure where Layer 3 BFD keepalives remained completely blind.

  • Automatic ~3 min failover during dead breakout behind active next-hop
  • End-to-end TCP session tracking vs blind Layer 3 tunnel keepalives
  • Continuous probe-driven failback once primary DC breakout is repaired
White Paper 2026-09-26

Beyond Ping: App vs Network Latency

Architectural deep-dive decomposing end-to-end user latency into Network RTT and Server Response Time (SRT) without agents or SSL decryption using dual synchronized telemetry.

  • 5.8 ms Network RTT vs 800 ms Server Response Time (SRT) clear isolation
  • Eliminates the "Is it the network?" blame game in minutes
  • Non-intrusive dual measurement with Stigix and Prisma SD-WAN SCM
AI-Assisted Lab Orchestration & Reporting Stigix exposes 89 network diagnostic and chaos impairment tools over FastMCP — enabling AI engines (like Claude Desktop) to autonomously execute test plans, analyze convergence curves, and draft executive-ready reports.
View All Sample Reports →

Installation & Deployment

Up and running in under 60 seconds

ⓘ Prerequisite Docker must be installed and running on your host. No other dependency required.  Install Docker →
bash — stigix deployment
# 1. Standalone / Leader Node Deployment
$ curl -sSL https://raw.githubusercontent.com/jsuzanne/stigix/main/install.sh | bash
🚀 Stigix (All-in-One) — Starting Leader services...
✅ Dashboard active → http://localhost:8080
# 2. Zero-Touch Remote Branch Onboarding (via Magic Join Token or --controller)
$ curl -fsSL https://raw.githubusercontent.com/jsuzanne/stigix/main/install.sh | sudo bash -s -- --join STX-eyJ1cmwiOiJodHRwOi8vMTkyLjE2OC4yMDMuMTAwOjgwODAifQ
✅ Registered to Leader [192.168.203.100:8080]. Syncing 8 Global Provisioning bundles...
# 3. Manual Compose Install
$ mkdir -p stigix && cd stigix && curl -sSL -o docker-compose.yml https://raw.githubusercontent.com/jsuzanne/stigix/main/docker-compose.yml && docker compose up -d
⚡
Distributed Mesh: Every Stigix instance is both a Sender and a Responder. Once deployed, the instance immediately starts generating traffic and listening as a custom TCP application server, multicast IGMPv3/UDP receiver, HTTP echo, bandwidth speedtest, voice echo, and SLA probe target.
Linux
Docker Engine · x86 / ARM64 servers, VMs, Raspberry Pi, or any Docker-capable appliance. Host network mode for full Layer-2/3 and IGMPv3/Scapy support.
macOS
Docker Desktop / OrbStack · macOS 11+. Bridge mode. Some Layer-2 constraints apply.
Windows
Docker Desktop + WSL 2 · Windows Install Guide — full Docker container support.

Operations & Automation

Control and verify with the built-in CLI

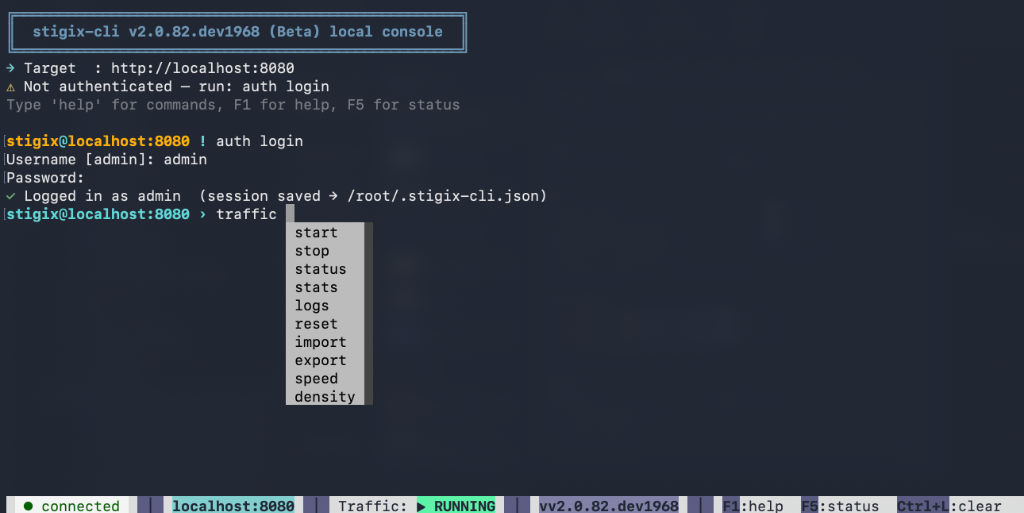
Stigix ships a fully interactive terminal console inside the container with support for Custom Apps, Multicast, Global Provisioning, DEM probes, and Controller mesh management.

stigix-cli — interactive console
# Launch the interactive console
$ docker exec -it stigix stigix-cli
stigix@localhost:8080 › tcp-app status erp-8443
━━ Application: ERP-Production (:8443) ━━━━━━━━━━
✓ Listener [LISTENING] (mode: fixed_delay 150ms)
✓ Outbound [RUNNING] (2 streams to DC1)
→ Health 98/100 [OPTIMAL] (p50: 16.2ms · p95: 24.1ms)
stigix@localhost:8080 › provision publish custom-tcp-apps
✓ Published custom-tcp-apps bundle rev-4 (diff: +1 app ~2 peers)
stigix@localhost:8080 › controller peers
→ BR1 (192.168.101.50) · BR2 (192.168.102.50) · DC1 (192.168.203.100)
🖥️
Scripting & CI/CD Pipelines: Execute non-interactive commands in batch or CI/CD pipelines with stigix-cli --exec "<command>". Full command history is saved to JSON for auditability and compliance.

Resources

Documentation & Guides